Observability and Response Architecture
Document Control:
Version: 1.0
Last Updated: January 30, 2026
Owner: Paul Leone
1. Architecture Overview
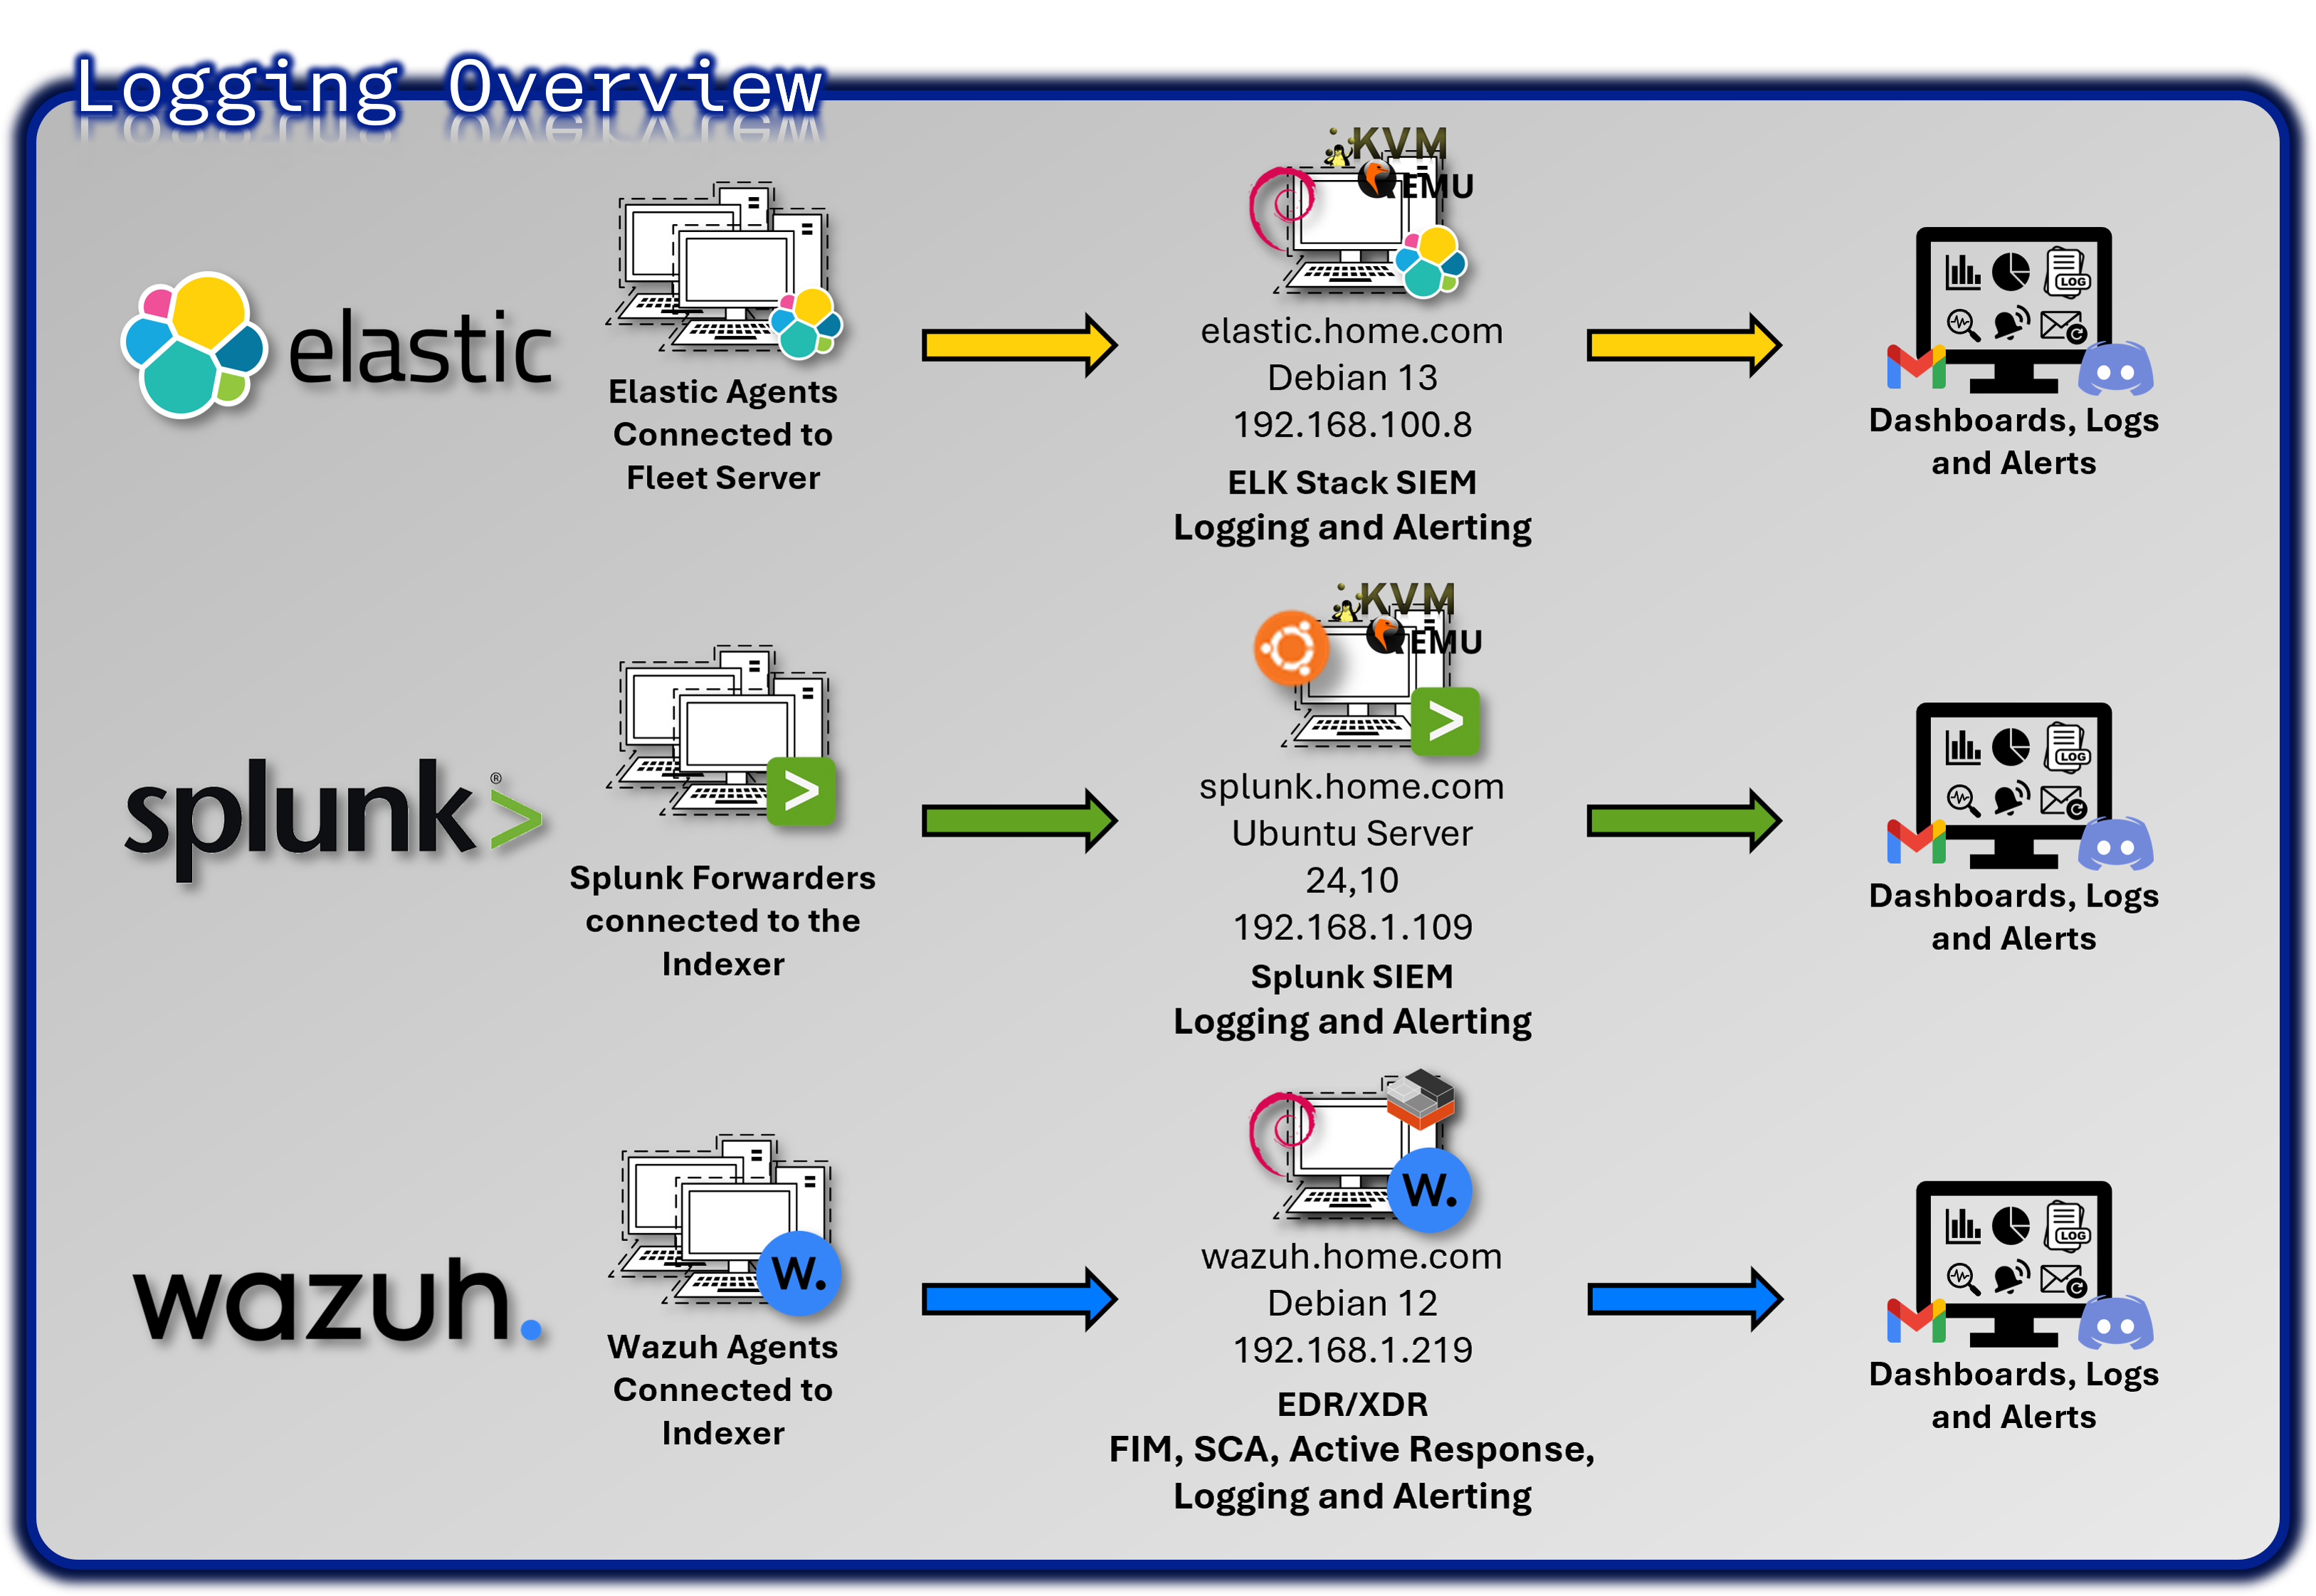
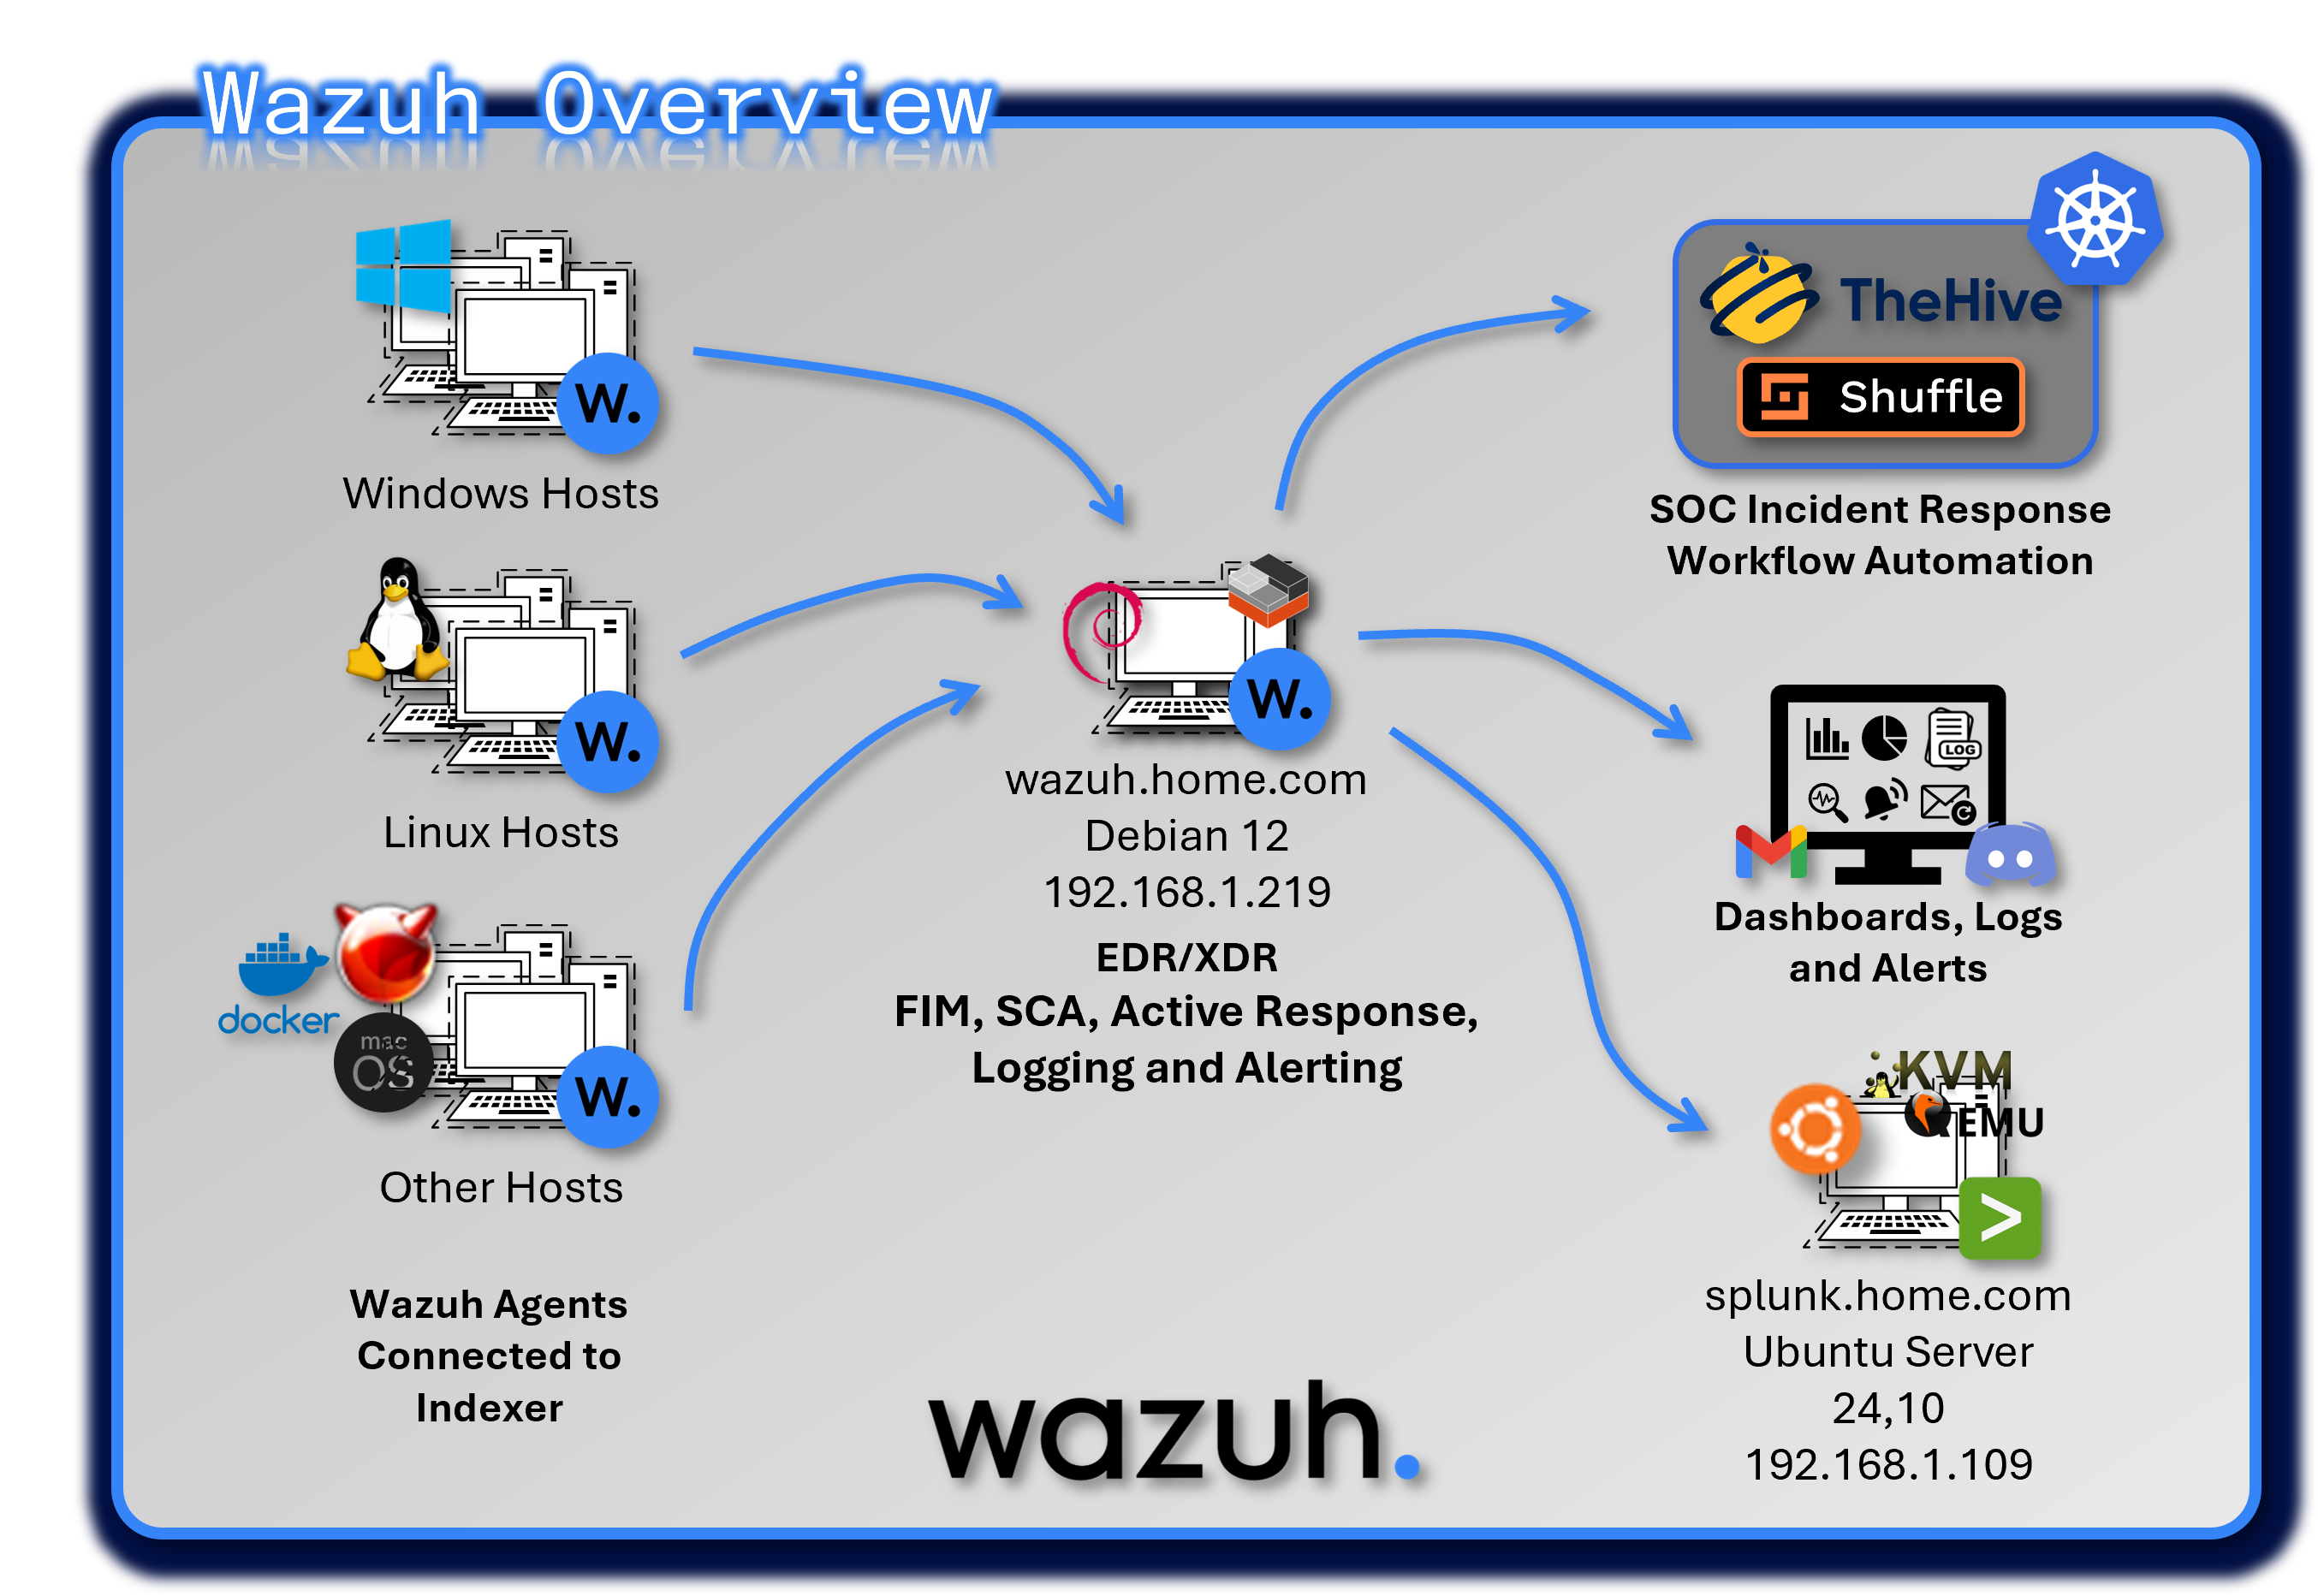
The lab implements a comprehensive observability and security monitoring stack that provides real-time visibility across infrastructure, applications, and security events. This multi-layered approach demonstrates enterprise-grade security operations center (SOC) capabilities and incident response readiness.
Core Technology Stack
- SIEM Platforms: Splunk Enterprise (primary), Elastic Stack (secondary)
- Endpoint Detection: Wazuh EDR agents deployed on 25+ hosts across Windows, Linux, BSD, and macOS
- Network Monitoring: Suricata/Snort IDS, pfSense logging, NetAlertX
- Infrastructure Monitoring: Prometheus + Grafana for metrics visualization, CheckMK for system monitoring
- Service Availability: Uptime Kuma for service availability tracking, Pulse for Proxmox-specific monitoring
- Alerting Hub: Discord notifications through webhooks and email alerts through local SMTP relay
Deployment Rationale
Security visibility is foundational to detecting and responding to threats before they cause damage. This architecture demonstrates:
- Correlation across multiple data sources: Network, host, and application telemetry
- Real-time detection: Security events and anomalies identified within seconds
- Hands-on experience: Industry-standard SIEM and monitoring tools (Splunk, Elastic, Prometheus, Wazuh)
- Enterprise SOC patterns: Integration workflows used in production environments
- Automated response: Incident response workflows triggered by alert conditions
Architecture Principles Alignment
Defense in Depth:
- Real-time SIEM correlation across multiple data sources (network, host, application)
- Multiple detection mechanisms reduce blind spots (SIEM, EDR)
- Correlation across network, application, and endpoint layers
- Redundant monitoring platforms (Splunk + Elastic) ensure continuity
Secure by Design:
- Integration patterns demonstrate enterprise SOC workflows
- Documented playbooks and alert workflows for incident response
Zero Trust:
- Continuous verification through comprehensive logging (100% security event coverage)
- Identity-aware monitoring tracks user behavior across systems
Strategic Value
Comprehensive Visibility:
- 360-degree view from network perimeter to application layer
- Unified dashboards provide single pane of glass for security posture
Defense in Depth:
- Multiple detection mechanisms reduce single points of failure
- Overlapping coverage ensures threats are caught by at least one control
Skills Development:
- Experience with commercial (Splunk) and open-source (Elastic) platforms
- Hands-on with tools directly transferable to SOC Analyst roles
Incident Response:
- Documented playbooks and alert workflows demonstrate operational maturity
- Integration with TheHive enables case management and forensic tracking
Compliance Readiness:
- Audit logs retained for 90 days with searchable correlation
- Immutable SIEM indexes support forensic investigations
- Comprehensive logging satisfies PCI-DSS 10.2, NIST SP 800-53 AU-2
Why Multiple SIEM Platforms?
Splunk (Primary):
- Mature SPL query language for security event correlation
- Industry-standard platform used in enterprise SOCs
- Robust alerting and dashboard capabilities
Elastic (Secondary):
- ECS (Elastic Common Schema) standardization for vendor-neutral data modeling
- Focus on application telemetry and infrastructure metrics
- Open-source alternative demonstrates platform versatility
Rationale: Dual deployment provides redundancy and learning opportunities with both commercial and open-source platforms commonly used in enterprise environments. This approach demonstrates adaptability and reduces vendor lock-in risk.
2. Splunk Enterprise SIEM Platform
Deployment Overview
Splunk Enterprise functions as the centralized Security Information and Event Management (SIEM) platform for the lab environment, providing unified log aggregation, correlation, and real-time detection across all security and infrastructure layers. The deployment uses a single-instance architecture optimized for lab-scale operations, with a clear expansion path toward distributed indexing and search head clustering as data volume grows.
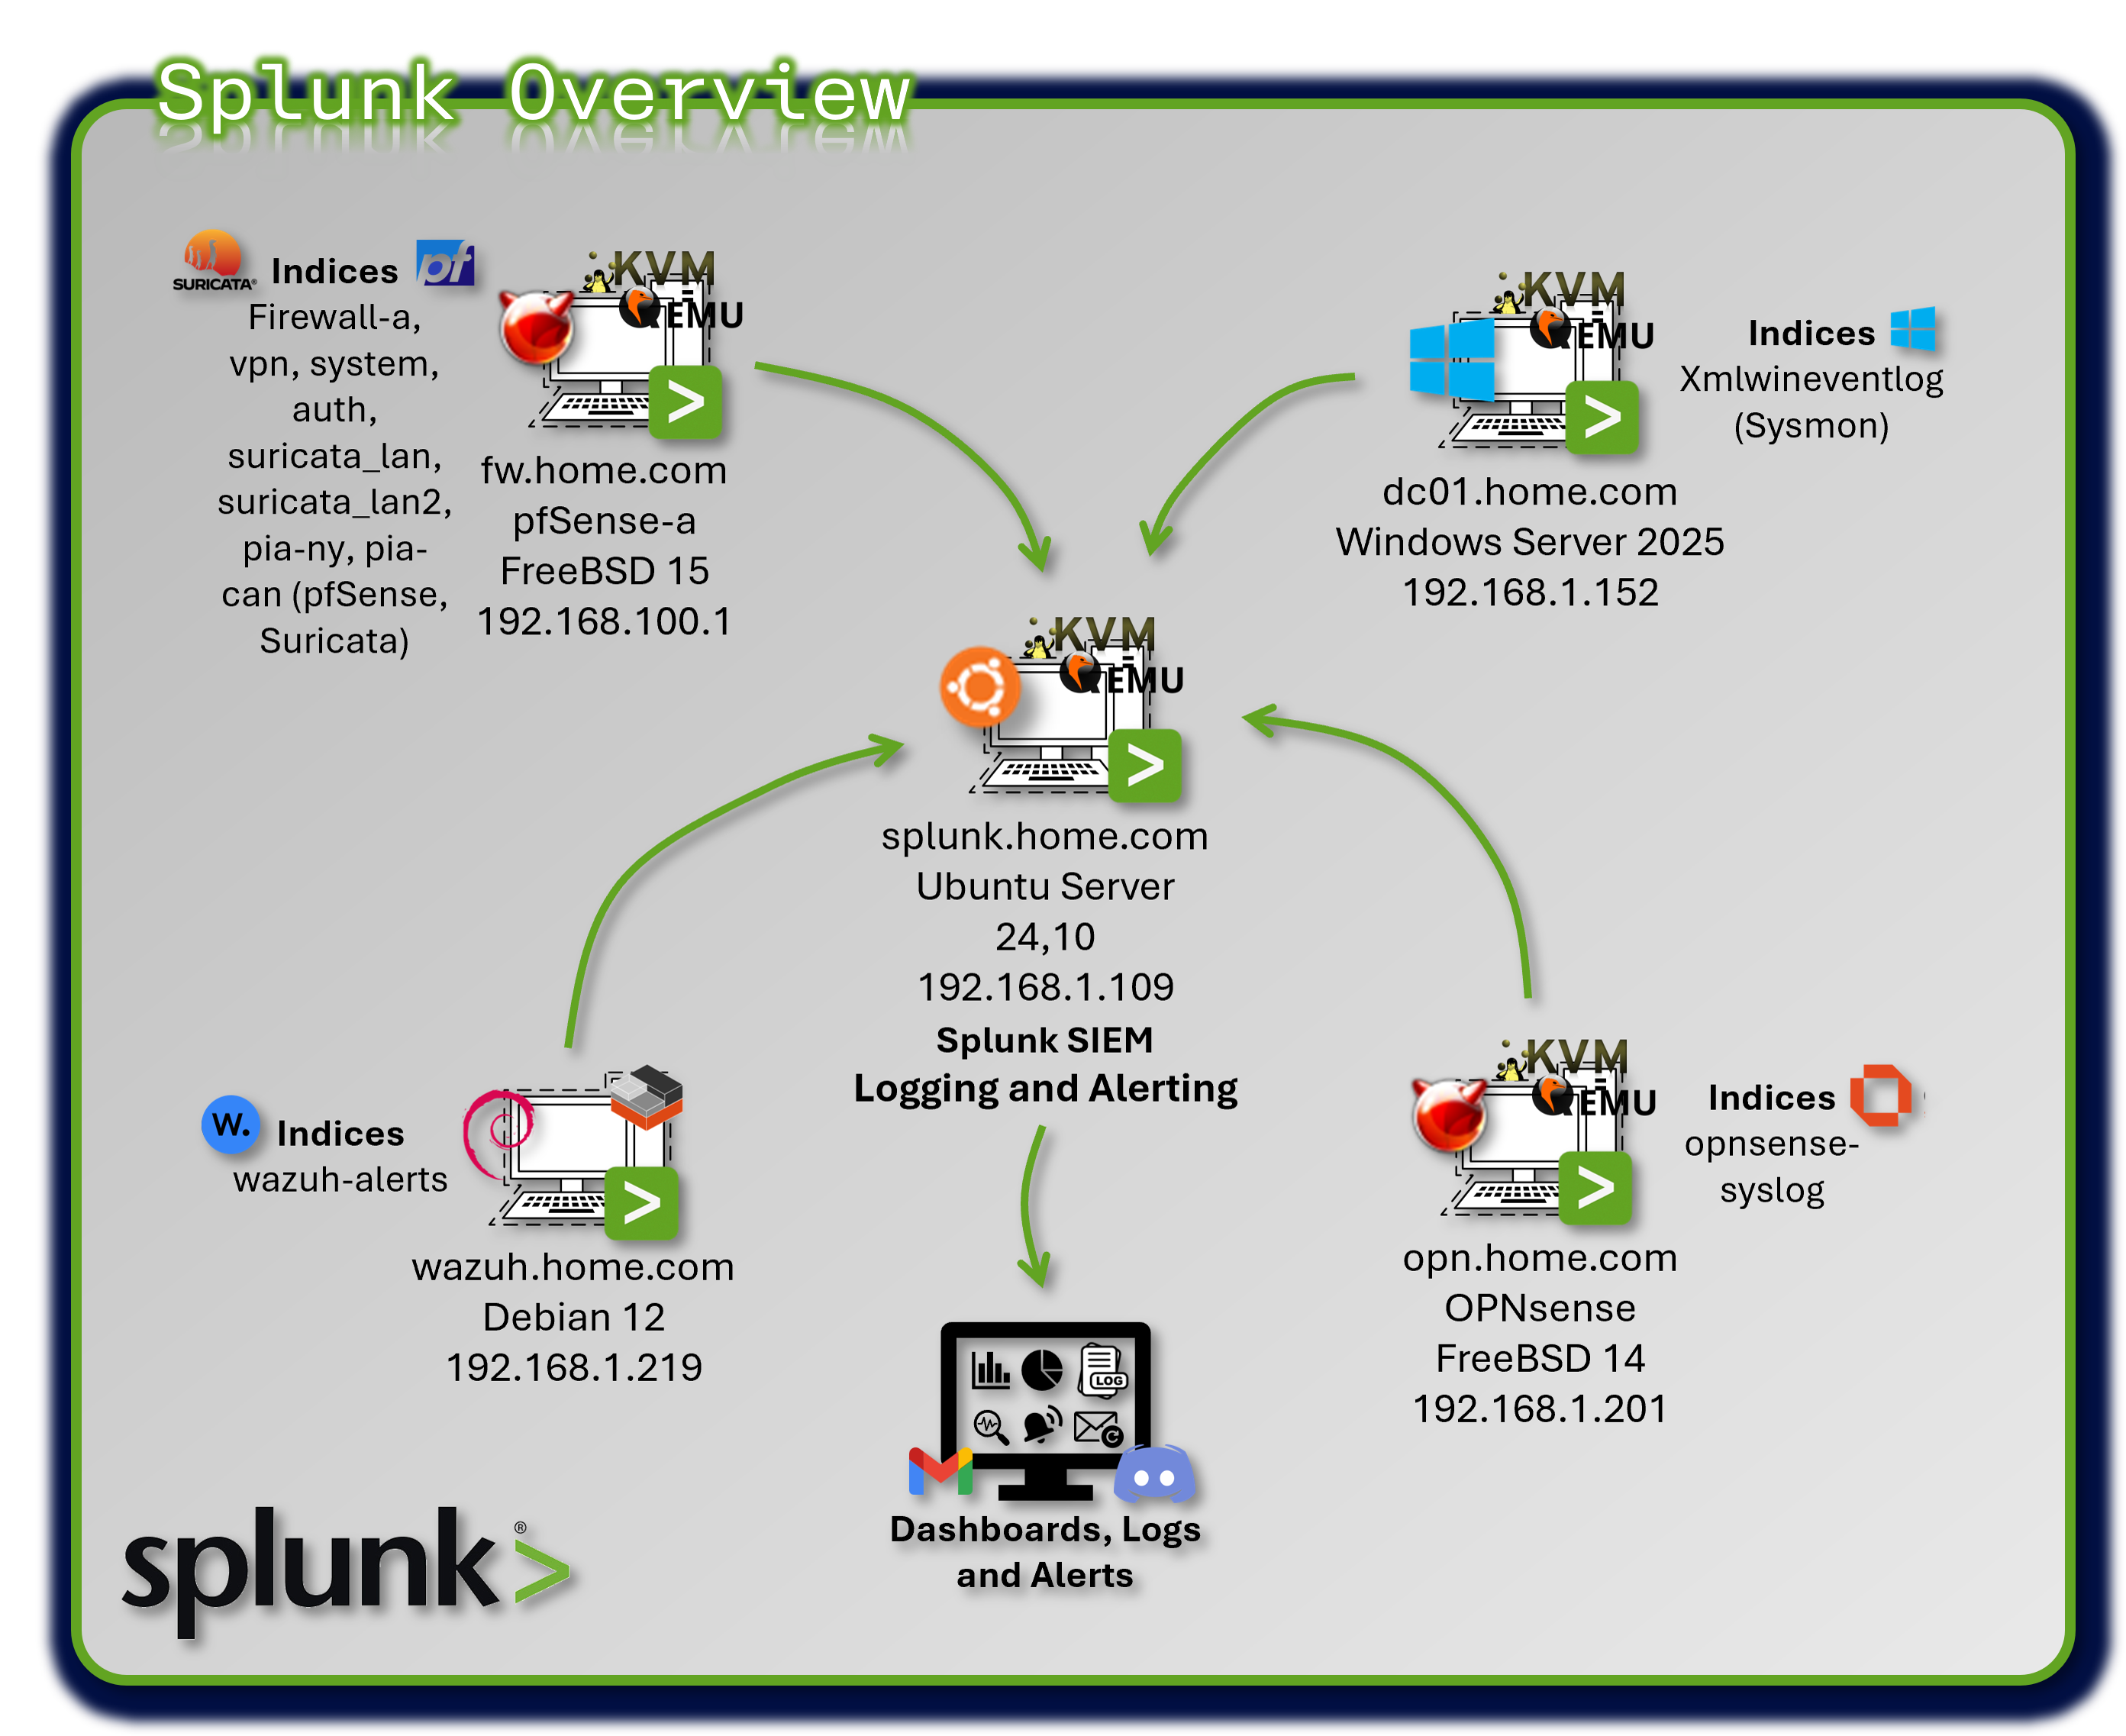
Splunk ingests telemetry from firewalls, IDS/IPS sensors, EDR agents, authentication systems, and application logs, normalizing events through the Common Information Model (CIM) to enable consistent, cross-source analytics.
Security Impact
Splunk delivers enterprise-grade detection and visibility by consolidating more than 30 data sources into a single analytical plane. Real-time alerting identifies brute-force attempts, port scans, anomalous authentication behavior, and early indicators of lateral movement. Correlation searches detect multi-stage attack patterns such as privilege escalation, internal reconnaissance, and data exfiltration.
Deployment Rationale
A SIEM is the analytical backbone of any modern security program, enabling defenders to transform raw telemetry into actionable intelligence. This Splunk deployment demonstrates core SIEM competencies found in enterprise environments: CIM-based normalization, multi-source correlation, automated alerting, and integration with downstream SOAR workflows.
Architecture Principles Alignment
Defense in Depth:
- Aggregates telemetry from every security layer (network, endpoint, identity, application)
- Correlation searches combine multiple signals to detect attacks that bypass single controls
- Redundant sourcetypes (pfSense, Suricata, Wazuh) ensure detection continuity
Secure by Design:
- CIM standardization enforces consistent field structures
- Universal Forwarders provide authenticated, encrypted log transport
- Automated alerting and workflow triggers reduce human error
Zero Trust:
- No event or data source is implicitly trusted
- Identity-centric analytics detect anomalous authentication
- Continuous monitoring ensures every action is observable
Deployment Architecture
| Component | Technology | Location | Purpose |
|---|---|---|---|
| Splunk Indexer | Splunk Enterprise 9.2.x | Ubuntu VM | Log storage and search |
| Splunk Forwarder | Universal Forwarder 9.2 | All monitored hosts | Log collection and forwarding |
| Data Inputs | Syslog, file monitoring | Various | Ingestion methods |
| Indexes | Time-series buckets | /opt/splunk/var/lib | Segmented storage |
Universal Forwarder Deployment
| Host Type | Forwarder Count | Logs Forwarded | Volume/Day |
|---|---|---|---|
| pfSense Firewalls | 2 | Firewall, VPN, System, Auth | 500 MB |
| OPNsense Firewall | 1 | Firewall logs | 100 MB |
| Suricata IDS | 4 (Internal LANs (Wasuh)) | IDS/IPS alerts, flow data | 2.5 GB |
| Snort IDS | 2 (VPN tunnels) | IDS alerts | 200 MB |
| Wazuh Manager | 1 | Security alerts, audit logs | 1 GB |
| Windows Hosts | 1 (Sysmon), 4 (Wazuh) | Sysmon XML events, Wazuh | 800 MB (Sysmon) |
| Linux Hosts | 23 (Wazuh) | Wazuh | |
| MacOS Hosts | 1 (Wazuh) | Wazuh |
Index Design
| Index Name | Data Sources | Retention | Size/Day | Purpose |
|---|---|---|---|---|
| firewall-a | pfSense filterlog | 90 days | 400 MB | Network traffic logs |
| vpn | pfSense VPN logs | 90 days | 50 MB | VPN connection logs |
| system | pfSense system logs | 90 days | 50 MB | System events |
| auth | pfSense auth logs | 90 days | 20 MB | Authentication events |
| opnsense-syslog | OPNsense firewall | 90 days | 100 MB | Firewall logs |
| suricata-prod_lan | Suricata Prod_LAN interface | 90 days | 1 GB | IDS alerts (internal) |
| suricata-lab_lan1 | Suricata Lab_LAN1 interface | 90 days | .5 GB | IDS alerts (internal) |
| suricata-lab_lan2 | Suricata Lab_LAN2 interface | 90 days | .5 GB | IDS alerts (internal) |
| suricata-ext_lan | Suricata Ext_LAN interface | 90 days | .5 GB | IDS alerts (external) |
| pia-ny | Snort on PIA NY tunnel | 90 days | 100 MB | VPN tunnel IDS |
| pia-can-mont | Snort on PIA Montreal | 90 days | 100 MB | VPN tunnel IDS |
| wazuh-alerts | Wazuh security events | 90 days | 1 GB | Endpoint security |
| xmlwineventlog | Windows Sysmon | 90 days | 800 MB | Windows telemetry |
Index Optimization:
- Hot/Warm/Cold Architecture: 7 days hot, 30 days warm, 53 days cold
- Compression: ~70% compression ratio on warm/cold buckets
- Frozen: Archive to NAS after 90 days (compressed tar.gz)
Log Aggregation
Data Inputs:
| Source | Input Type | Method | Notes |
|---|---|---|---|
| Wazuh | JSON over TCP | Splunk Universal Forwarder | Includes security alerts and audit logs |
| pfSense | Log files | Splunk Universal Forwarder | Firewall logs, VPN, authorization, and System |
| Suricata | JSON over File | Splunk Universal Forwarder | IDS/IPS alerts, flow data |
| OPNsense | Syslog (UDP) | Splunk Universal Forwarder | Firewall logs |
| Sysmon | XML via EventLog | Splunk Universal Forwarder | Windows endpoint telemetry, process tracking |
Data Normalization and Field Extraction
Common Information Model (CIM) Compliance:
Splunk CIM provides standardized field names across data sources for correlation.
| CIM Data Model | Normalized Fields | Source Types |
|---|---|---|
| Network Traffic | src_ip, dest_ip, src_port, dest_port | pfsense:filterlog, suricata |
| Authentication | user, src, dest, action | pfsense:auth, wazuh-alerts |
| Intrusion Detection | signature, severity, category | suricata, snort |
| Endpoint | process, parent_process, user | xmlwineventlog:sysmon |
Field Extraction Example (transforms.conf):
[pfsense-filterlog-extract]
REGEX = ^(\S+)\s+\S+\s+filterlog\[\d+\]:\s+\d+,,,(\d+),(\w+),(\d+),(\S+),(\d+),(\S+),(\d+),(\w+),(\d+),(\d+),(\d+),(\S+),(\d+),(\d+),(\d+),(\d+),(\w+)
FORMAT = interface::$1 rule_number::$2 action::$3 protocol::$4 src_ip::$5 src_port::$6 dest_ip::$7 dest_port::$8
Searches, Reports, and Dashboards
SIEM Overview Dashboard
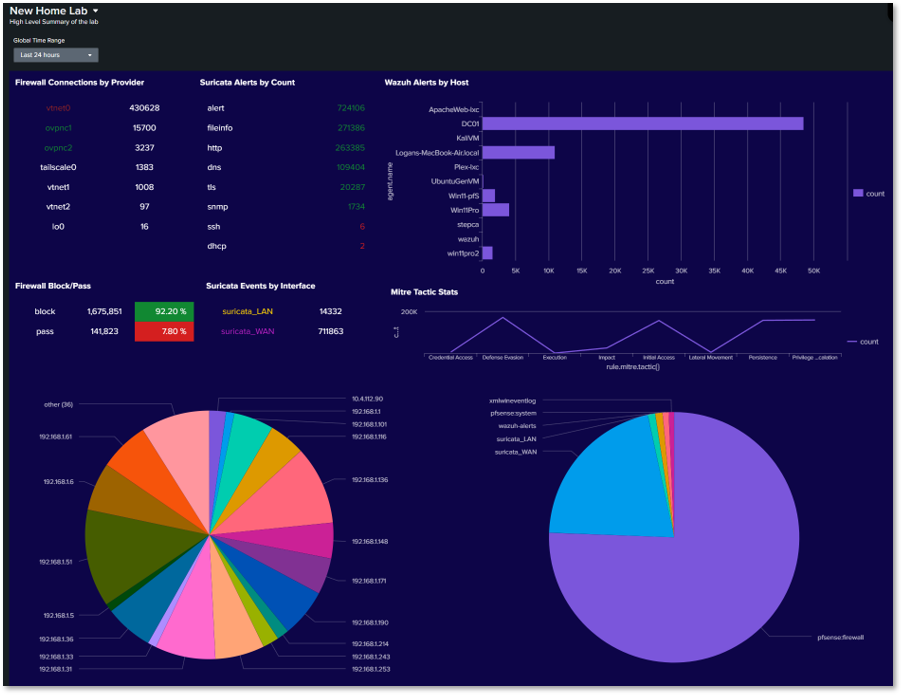
Panels:
- Firewall Connections by Provider: A chart/table that lists network interfaces (providers) like vtnet0, vtnet1, tailscale0, etc., alongside the count of connections associated with each.
- Suricata Alerts by Count: Lists specific types of Suricata security alerts (alert, fileinfo, http, dns, tls, snmp, ssh, dhcp) and their frequency (count). alert has the highest count at 430,628.
- Wazuh Alerts by Host: A horizontal bar chart showing the count of alerts generated by specific hosts or agents (ApacheWeb-tec, DC01, KVM, etc.). ApacheWeb-tec has the highest alert count at over 40,000.
- Firewall Block/Pass: A status indicator showing the total count and percentage of blocked (1,675,851 / 92.20%) versus passed traffic (141,823 / 7.80%).
- Suricata Events by Interface: A colorful pie chart visualizing which internal IP addresses or network segments (192.168.x.x ranges) are generating the most Suricata security events.
- Mitre Tactic Stats: A line/area chart tracking the count of events mapped to different MITRE ATT&CK Tactics over time, such as Defense Evasion, Impact, Lateral Movement, etc.
- Services Pie Chart: A large pie chart showing the distribution of traffic categorized by the application or service, likely derived from flow logs or firewall data.
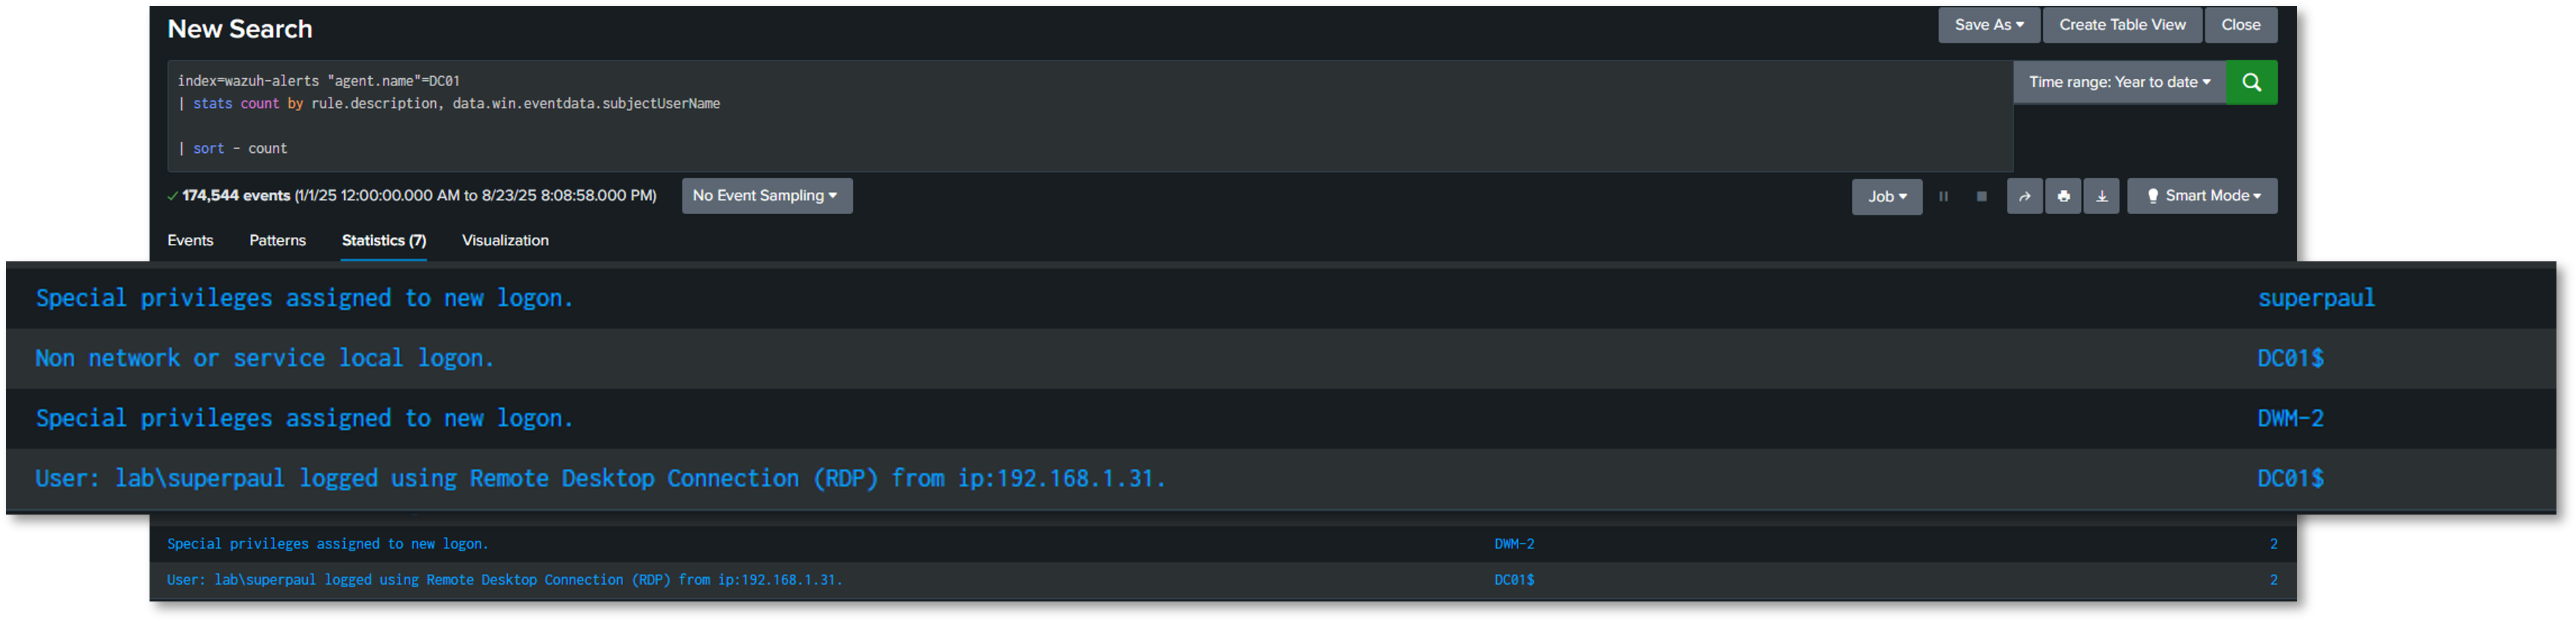
Wazuh alerts for my Windows Server 2022 Domain Controller
Query: index=wazuh-alerts agent.name=DC01
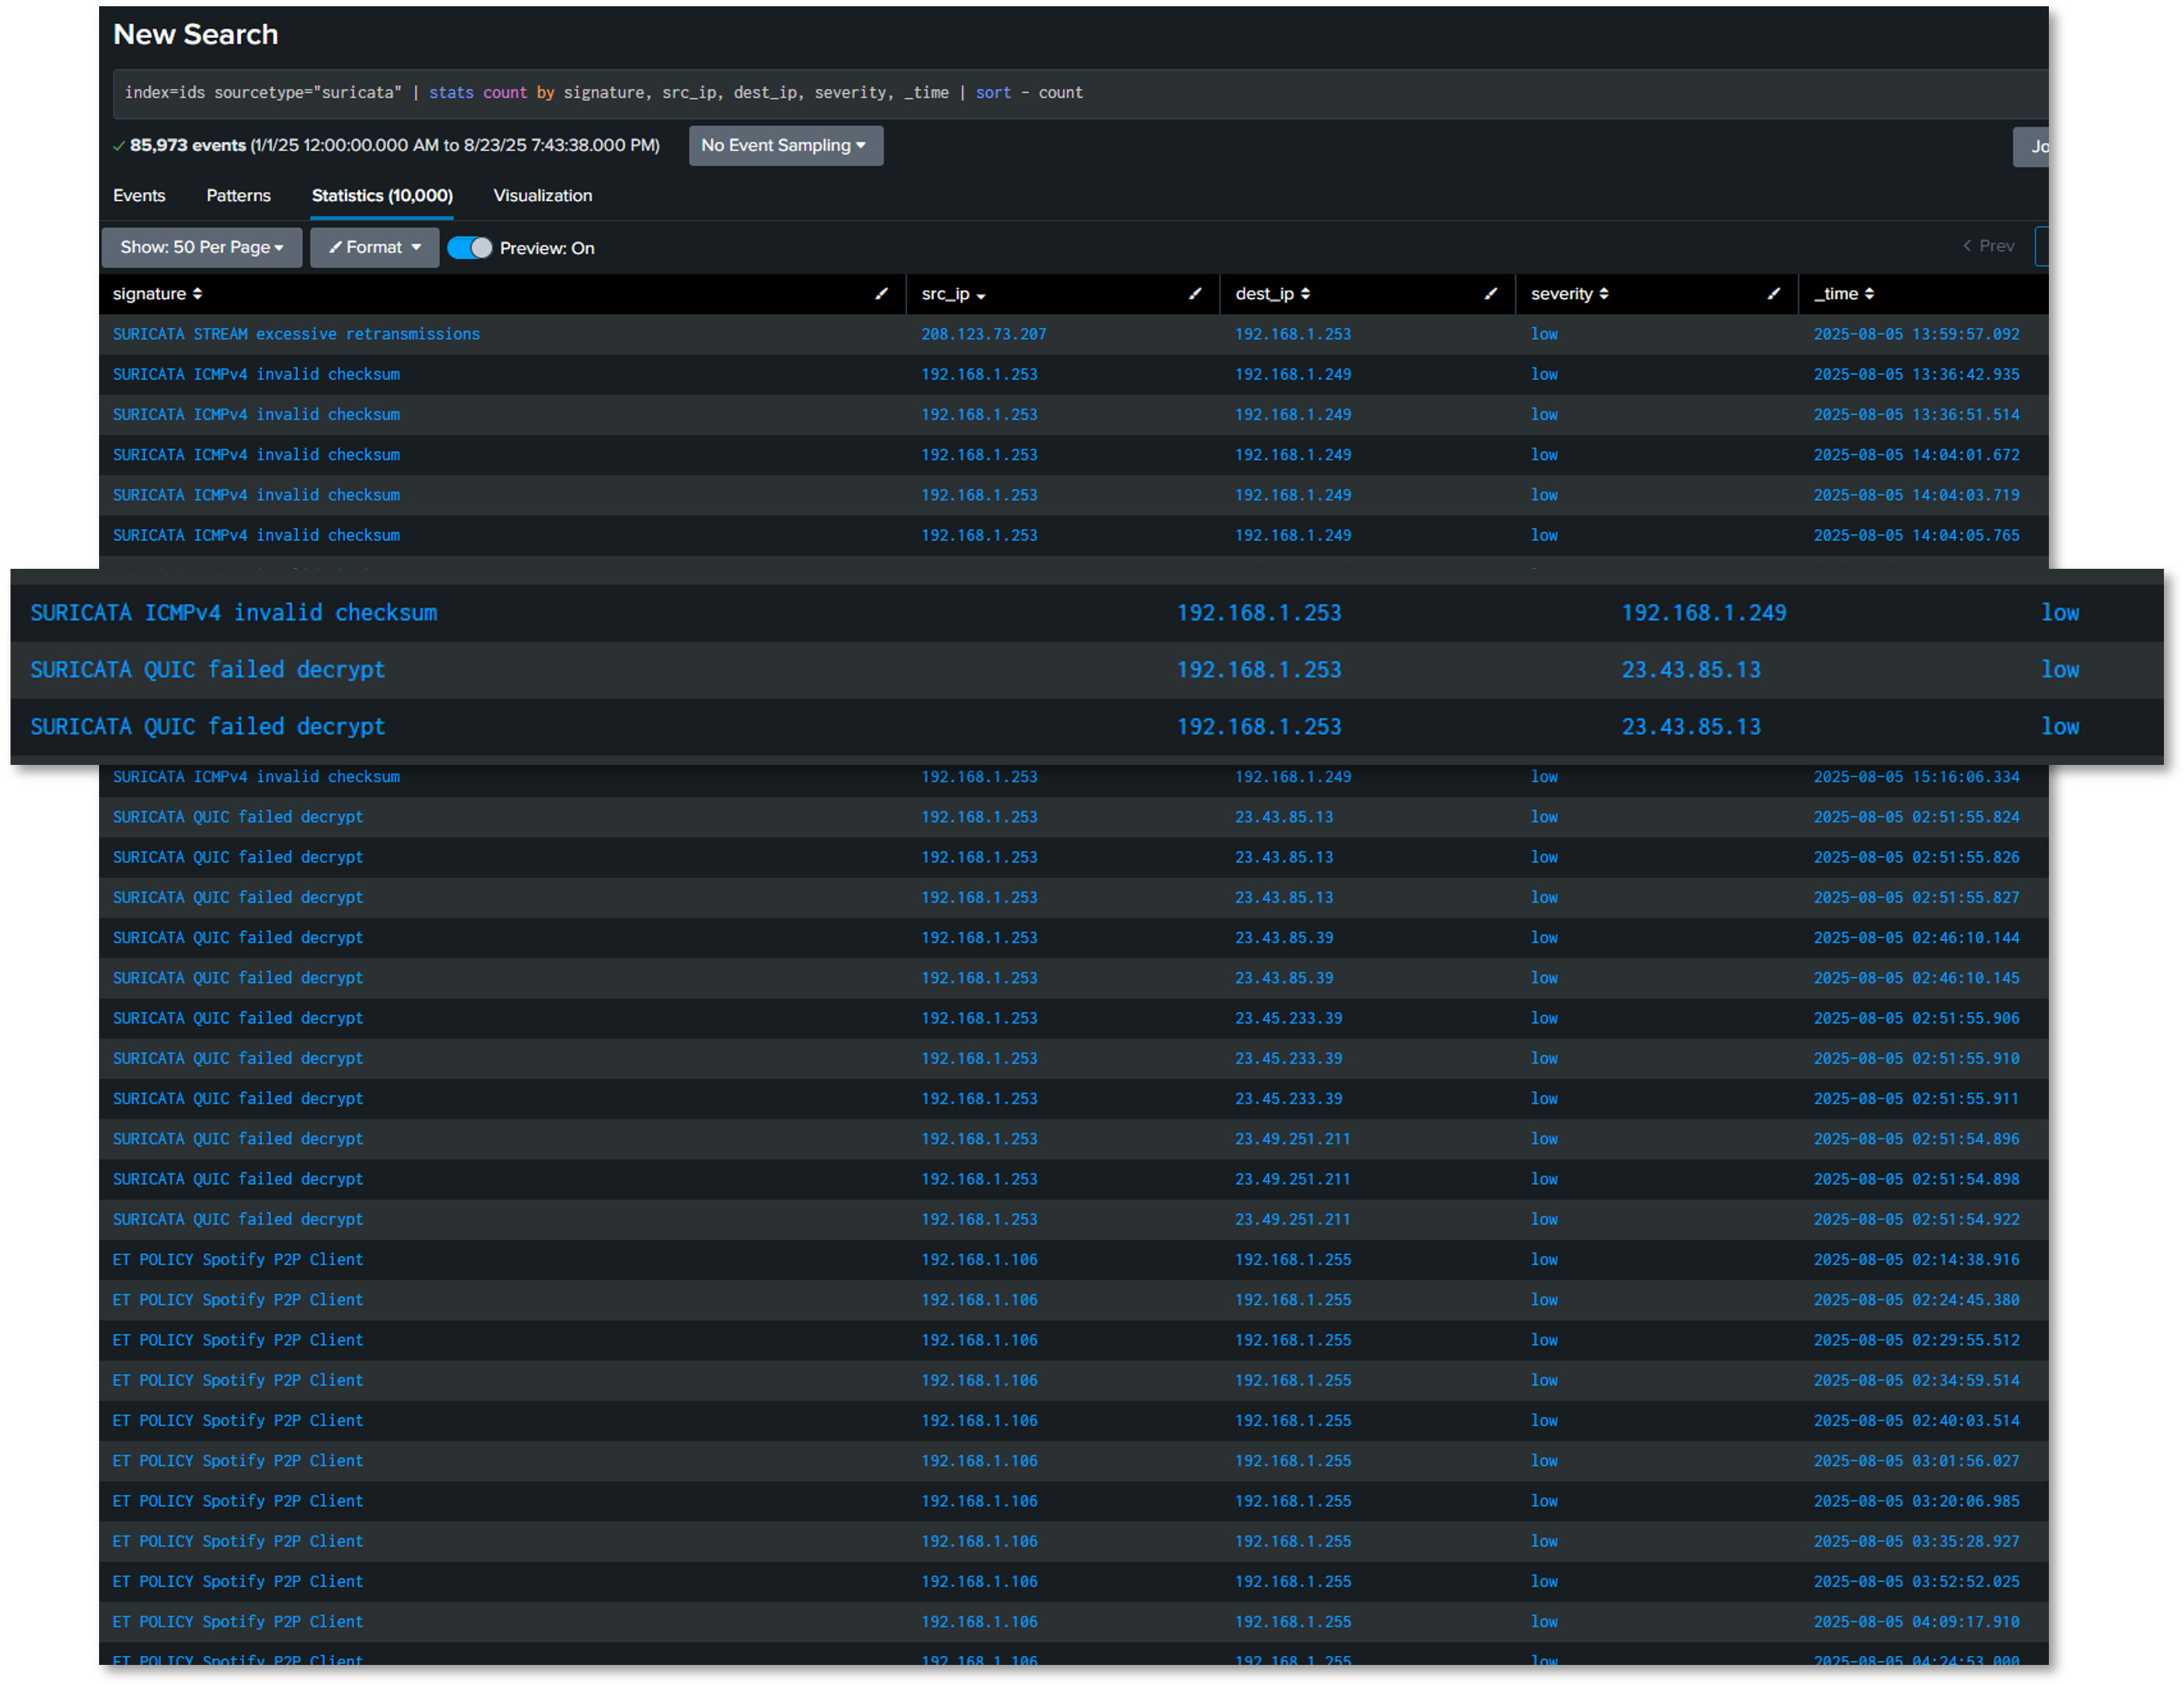
Intrusion Prevention System Alerts
Query: index=ids sourcetype=suricata
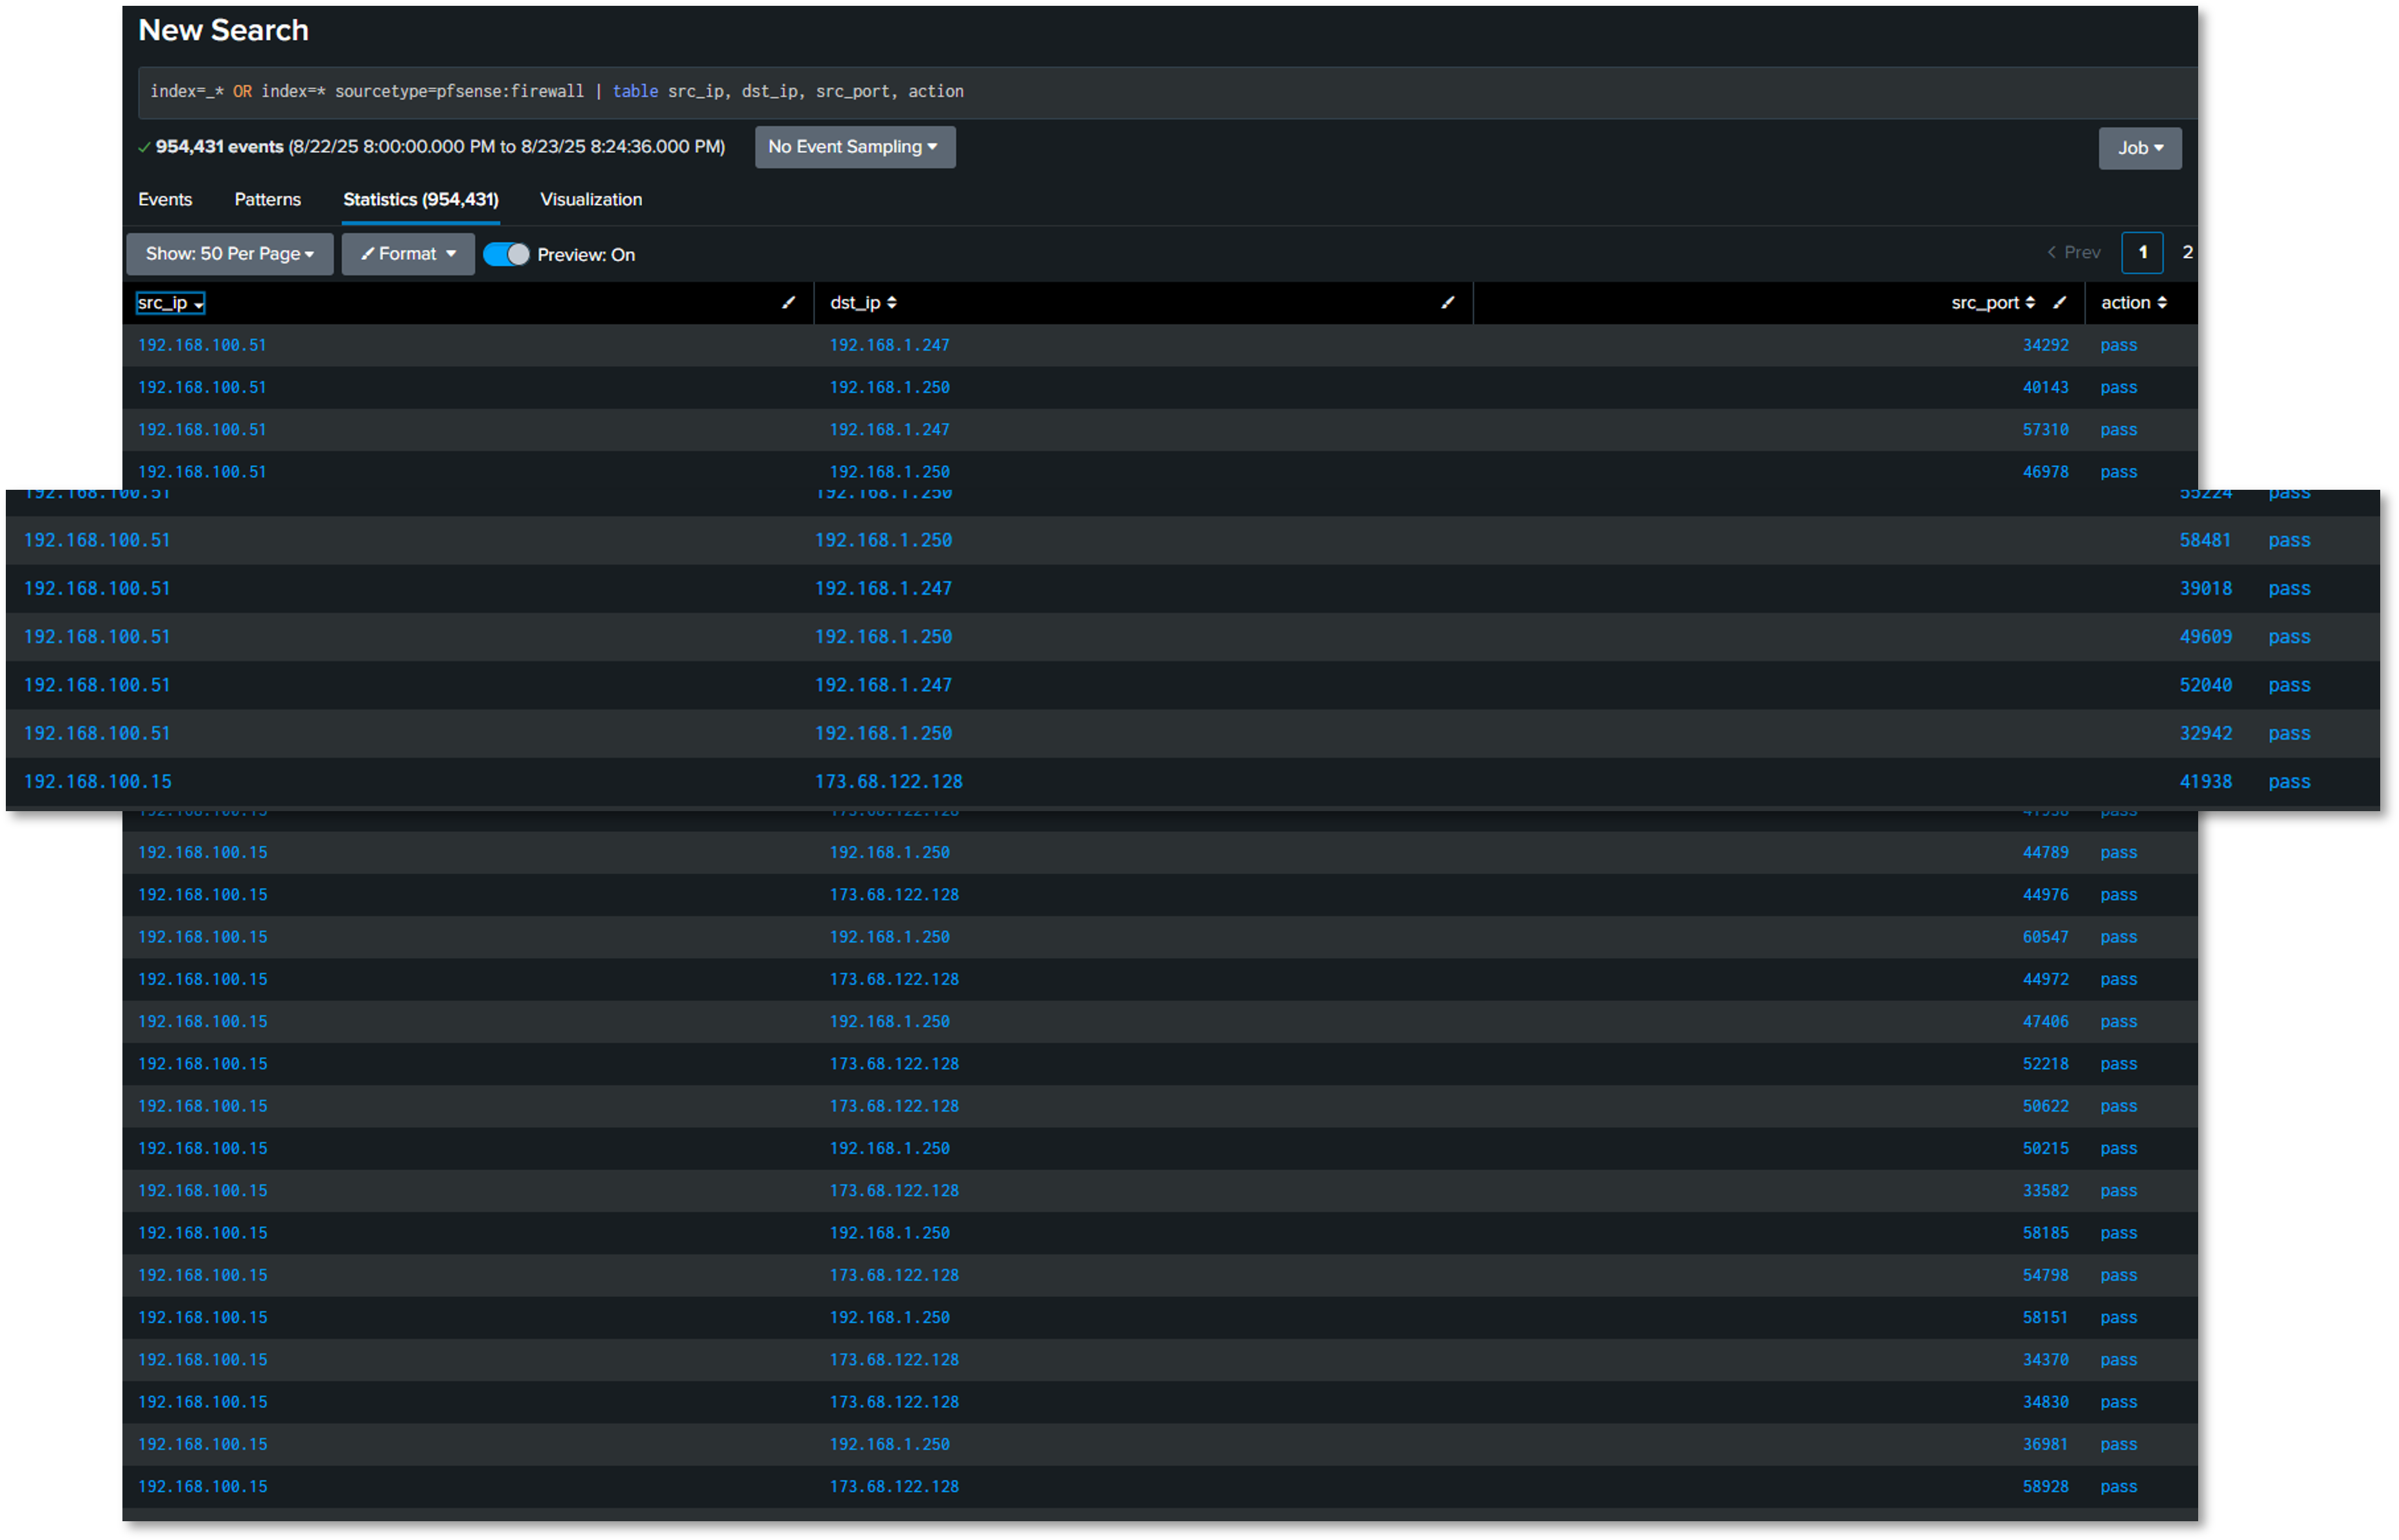
Firewall Filter Logs
Query: index=firewall-a sourcetype=pfsense:firewall
Search Examples
Brute Force Detection (Multi-Source)
(index=auth sourcetype=pfsense:auth "Failed password") OR
(index=wazuh-alerts rule.description="*authentication failed*")
| eval src_ip=coalesce(src,source_ip)
| stats count by src_ip, dest
| where count > 10
| eval threat_level="High"
Port Scan Detection
index=firewall-a action=block
| stats dc(dest_port) as unique_ports, count by src_ip, dest_ip
| where unique_ports > 50 AND count > 100
| eval description="Possible port scan: ".src_ip." scanning ".unique_ports." ports on ".dest_ip
VPN Traffic Analysis
index=firewall-a sourcetype=pfsense:filterlog
| eval interface=if(like(interface,"%ovpnc%"),"VPN","Direct")
| stats sum(bytes) as total_bytes by interface
| eval total_gb=round(total_bytes/1024/1024/1024,2)
Alert Configuration
Scheduled Alerts:
| Alert Name | Search Schedule | Trigger Condition | Action |
|---|---|---|---|
| Failed SSH Brute Force | Every 5 minutes | >20 failed attempts | Discord |
| Critical Wazuh Alert | Real-time | rule.level >= 12 | Discord |
| Suricata High Severity | Every 15 minutes | alert.severity = 1 | Discord |
| VPN Tunnel Down | Every 1 minute | No VPN traffic in 2 min | Discord |
| Anomalous Outbound Traffic | Every 30 minutes | Bytes > 10GB in 30min | Discord |
Alert Tuning and False Positive Management:
- Baseline Period: 30 days to establish normal behavior
- Dynamic Thresholds: Adjust based on time of day, day of week
- Whitelist: Known benign IPs/hosts excluded from alerts
- Alert Suppression: Maximum 1 alert per source per hour
- Escalation: Critical alerts escalate after 15 minutes if unacknowledged
Security Use Cases
Use Case 1: Lateral Movement Detection
Objective: Detect unauthorized account access across multiple systems
SPL Query:
index=wazuh-alerts OR index=auth
| eval user=coalesce(user.name,user)
| stats dc(agent.name) as unique_hosts by user
| where unique_hosts > 5
| eval threat="Potential lateral movement: user accessed ".unique_hosts." hosts"
Use Case 2: Data Exfiltration Detection
Objective: Identify large outbound data transfers
SPL Query:
index=firewall-a action=pass
| eval outbound=if(like(dest_ip,"192.168.%"),0,1)
| where outbound=1
| stats sum(bytes) as total_bytes by src_ip, dest_ip
| where total_bytes > 1073741824
| eval total_gb=round(total_bytes/1024/1024/1024,2)
| eval alert="Potential data exfiltration: ".total_gb."GB transferred"
Use Case 3: Malware Execution Detection
Objective: Detect execution of known malicious files
SPL Query:
index=xmlwineventlog EventCode=1
| eval md5=lower(Hashes)
| lookup malware_hashes.csv md5 OUTPUT malware_name
| where isnotnull(malware_name)
| table _time, Computer, User, Image, malware_name, CommandLine
3. Elastic Stack (ELK) Observability Platform
Deployment Overview
The Elastic Stack provides end-to-end observability across applications, infrastructure, and security events using the Elastic Common Schema (ECS) for standardized data modeling. This deployment emphasizes application performance monitoring (APM), infrastructure telemetry, and container visibility, complementing Splunk's security-centric analytics.
Fleet Server centrally manages more than 25 distributed Elastic Agents, enforcing consistent policies across hybrid environments including VMs, Docker containers, and Kubernetes workloads. Kibana dashboards deliver real-time insights into system performance, application behavior, and operational health.
Security Impact
Elastic enhances the security posture by delivering deep visibility into application and infrastructure behavior. ECS-compliant data modeling enables vendor-neutral threat detection and correlation across diverse telemetry sources. Infrastructure metrics expose resource exhaustion attacks, while container security monitoring identifies anomalous behavior within Docker and Kubernetes environments.
Deployment Rationale
While Splunk serves as the primary SIEM for security event correlation, Elastic Stack provides complementary strengths in application-level observability, infrastructure telemetry, and open-source analytics. ECS-based normalization supports vendor-agnostic correlation and multi-SIEM workflows.
Architecture Principles Alignment
Defense in Depth:
- Adds application-level and infrastructure-level visibility
- Container and Kubernetes monitoring provide additional layers of behavioral detection
- ECS normalization enables correlation across heterogeneous data sources
Secure by Design:
- ECS enforces consistent field structures
- Fleet Server centralizes agent policy enforcement
- Scalable architecture supports high-cardinality metrics
Zero Trust:
- No telemetry source is implicitly trusted
- Continuous monitoring of applications, containers, and infrastructure
- Segmented data pipelines prevent cross-contamination
Component Architecture
- Elasticsearch: Distributed search and analytics engine that stores and indexes structured and unstructured data
- Logstash: Data processing pipeline that ingests, transforms, and forwards logs to Elasticsearch (used selectively)
- Kibana: Visualization and management interface for exploring data, building dashboards, and managing Fleet
- Fleet Server: Manages Elastic Agent enrollment, policy distribution, and secure communication with Elasticsearch
Core ELK Stack Configuration
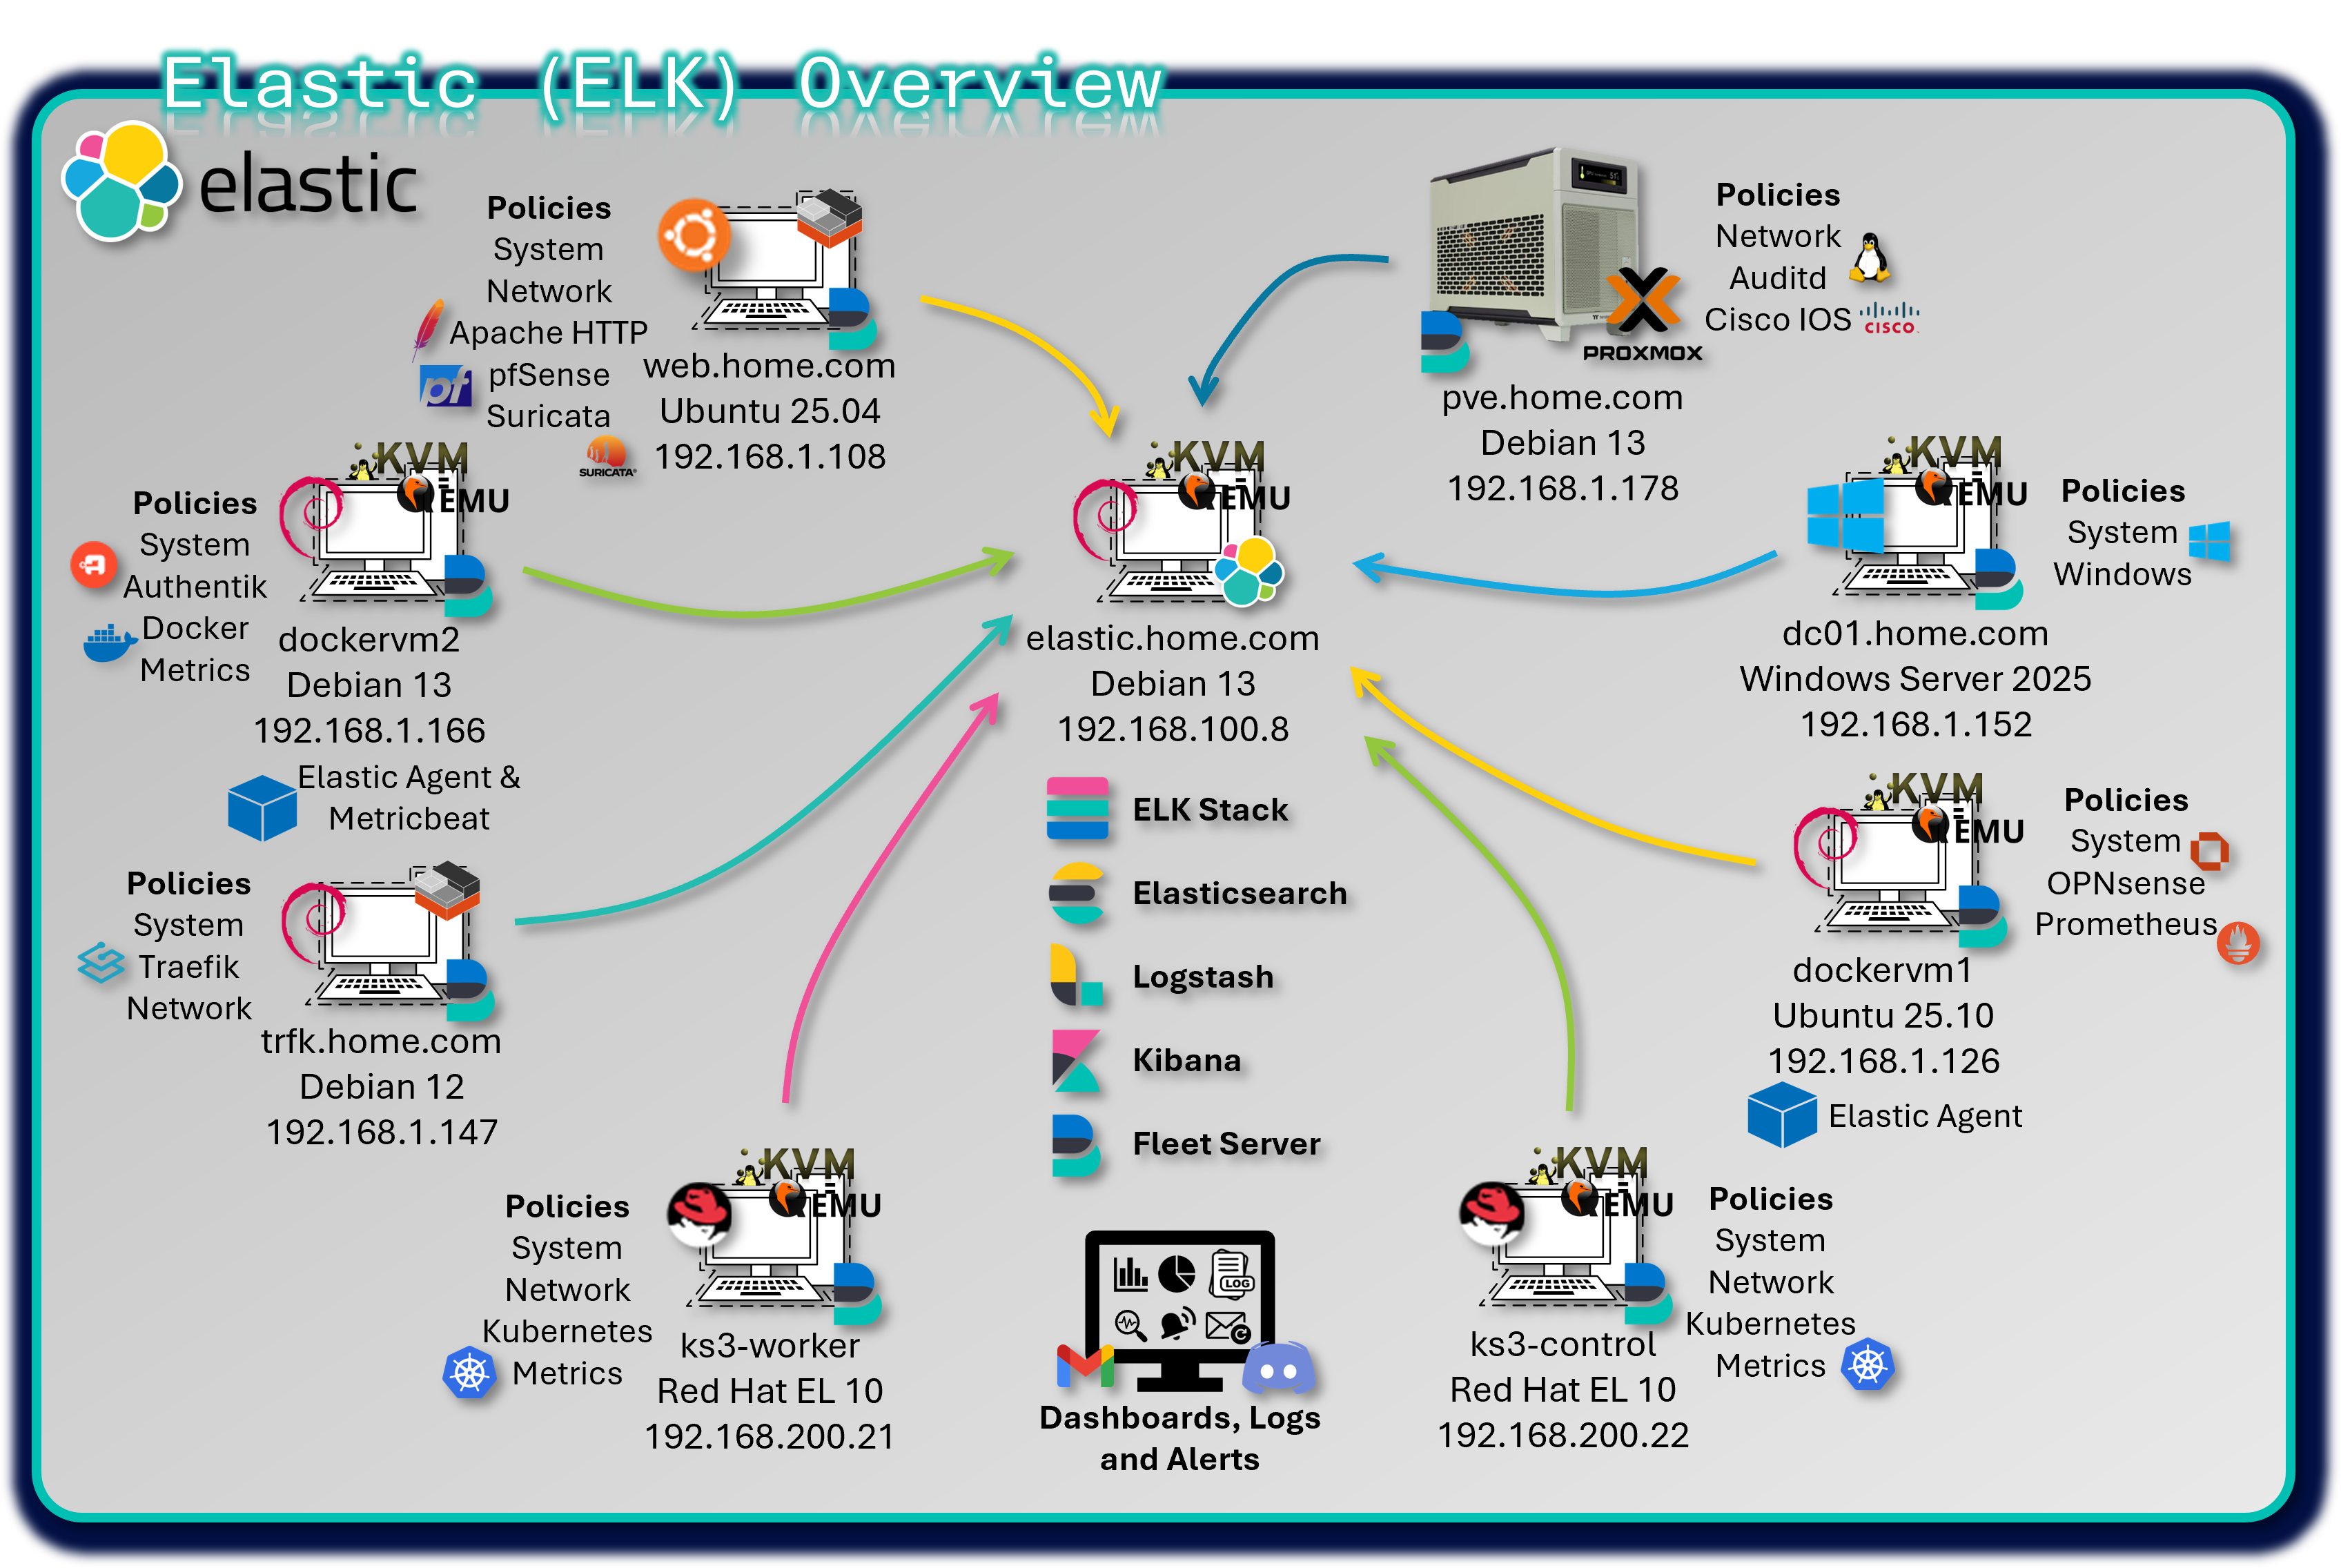
The central Elastic Stack is deployed on a KVM virtual machine running Debian 13, hosting:
- Elasticsearch, Logstash, and Kibana (ELK)
- Fleet Server and a local Elastic Agent
- Version: 9.2.1
This VM serves as the central ingest, processing, and visualization hub for all telemetry across the lab environment.
Distributed Elastic Agents
Elastic Agents are deployed across multiple hosts, each assigned a tailored Fleet policy with relevant integrations:
| Hostname | OS / Platform | Agent Policy Integrations |
|---|---|---|
| Traefik LXC Host | LXC container | system, Traefik integration for access logs and metrics, network packet capture |
| DC01 | Windows Server 2022 VM | system, Windows, and Sysmon integrations for endpoint and process telemetry |
| DockerVM1 | Ubuntu VM | system, Prometheus, and OPNSense (pfSense) integrations |
| DockerVM2 | Docker container running on Debian VM | system, Docker, authentik integration for event and user activity logs |
| Proxmox PVE Host | Proxmox VE (Debian) | system, Auditd integration for kernel-level audit logging, Cisco IOS Syslog |
| Ubuntu-Apache LXC | LXC container | system, Apache HTTP Server, Suricata, and pfSense integrations for web and IDS logs |
| K3s-control | Kubernetes container | System, Kubernetes metrics, network packet capture |
| K3s-worker | Kubernetes container | System, Kubernetes metrics, network packet capture |
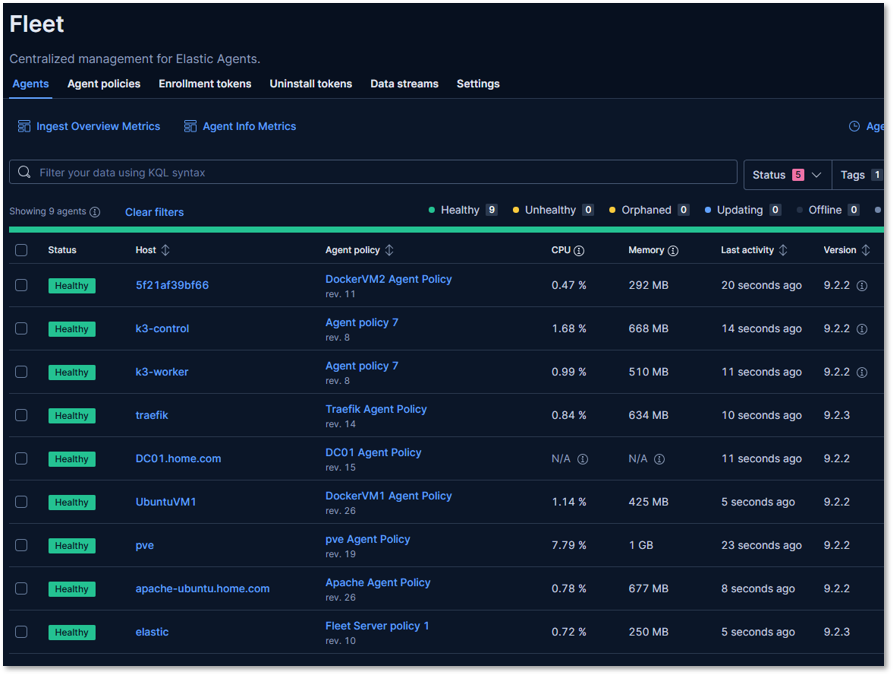
Each agent is enrolled via Fleet and centrally managed through Kibana, enabling consistent policy updates, secure API key rotation, and streamlined observability across the lab.
Fleet Policy Configuration
Example: Windows Endpoint Policy
Integrations:
- System: CPU, memory, disk, network metrics
- Windows: Event logs (Security, Application, System)
- Sysmon: Process creation, network connections, registry changes
Data Stream Configuration:
logs-windows.sysmon-default:
- EventID 1: Process creation
- EventID 3: Network connection
- EventID 7: Image loaded
- EventID 10: Process access
- EventID 11: File creation
- EventID 13: Registry value set
metrics-system.cpu-default:
- Metricset: cpu
- Period: 10s
- CPU percentages: user, system, idle, iowait
Elastic Common Schema (ECS) Mapping
ECS Field Standardization:
| Integration | ECS Dataset Prefix | Key ECS Fields Used |
|---|---|---|
| System | system.* | host.name, process.name, user.name, event.type |
| Windows/Sysmon | windows.* | event.code, process.parent.name, registry.path |
| Docker | docker.* | container.id, container.image.name, host.hostname |
| Prometheus | prometheus.* | metricset.name, service.name, labels.* |
| Suricata | suricata.eve | network.protocol, source.ip, event.category |
| Apache | apache.access | http.request.method, url.path, user_agent.name |
| Authentik | authentik.* (custom) | user.name, event.action, event.dataset |
| Auditd | auditd.* | process.executable, event.action, user.id |
| pfSense/OPNSense | firewall.* | source.ip, destination.port, event.outcome |
ECS Benefits:
- Vendor Neutrality: Same queries work across different data sources
- Future-Proof: Adding new integrations automatically compatible
- Community Standard: Widely adopted in security and observability communities
Kibana Dashboards
Ingest Pipelines
- Filebeat-style inputs via Elastic Agent for eve.json, Apache logs, and custom JSON
- Syslog inputs for pfSense and OPNSense firewall logs
- HTTP JSON inputs for Authentik API event collection
- Processors include:
- decode_json_fields for NDJSON
- add_fields for tagging source and dataset
- geoip and user_agent enrichment where applicable
Dashboard Examples
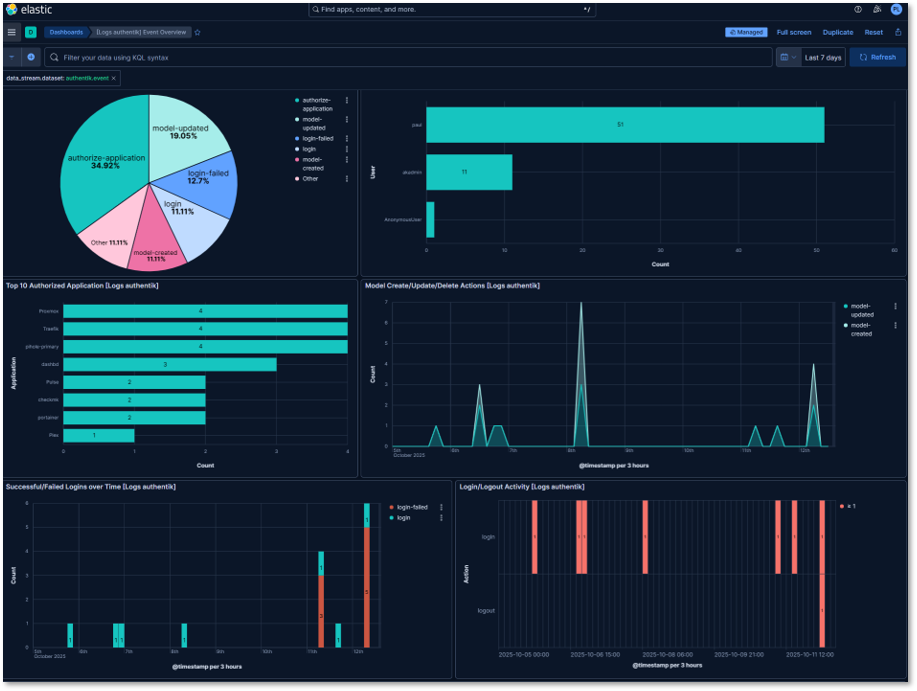
Authentik Authentication Dashboard:
Visualizations:
- Login Success Rate: Pie chart showing successful vs failed logins
- Login Attempts by User: Bar chart
- Geographic Login Distribution: Map of source.geo.location
- Authentication Timeline: Bar chart of login events
- Top Applications Accessed: Pie chart of event.dataset
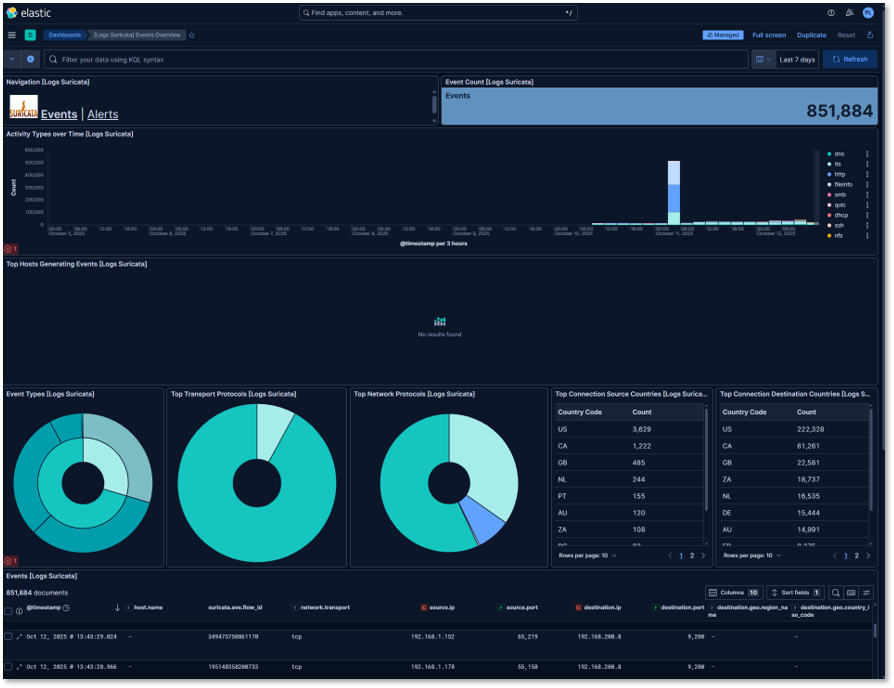
Suricata IDS Dashboard:
Visualizations:
- Event Count
- Alert Severity Distribution: Pie chart (Critical, High, Medium, Low, Info)
- Activity Types Over Time: Stacked bar chart with 5-minute buckets
- Top Attack Signatures: Data table with alert.signature and count
- Protocol Breakdown: Donut chart of network.protocol
- Destination Ports: Heatmap of frequently targeted ports
Example Kibana Query (KQL):
event.dataset: suricata.eve AND event.kind: alert AND alert.severity: [1 TO 2]
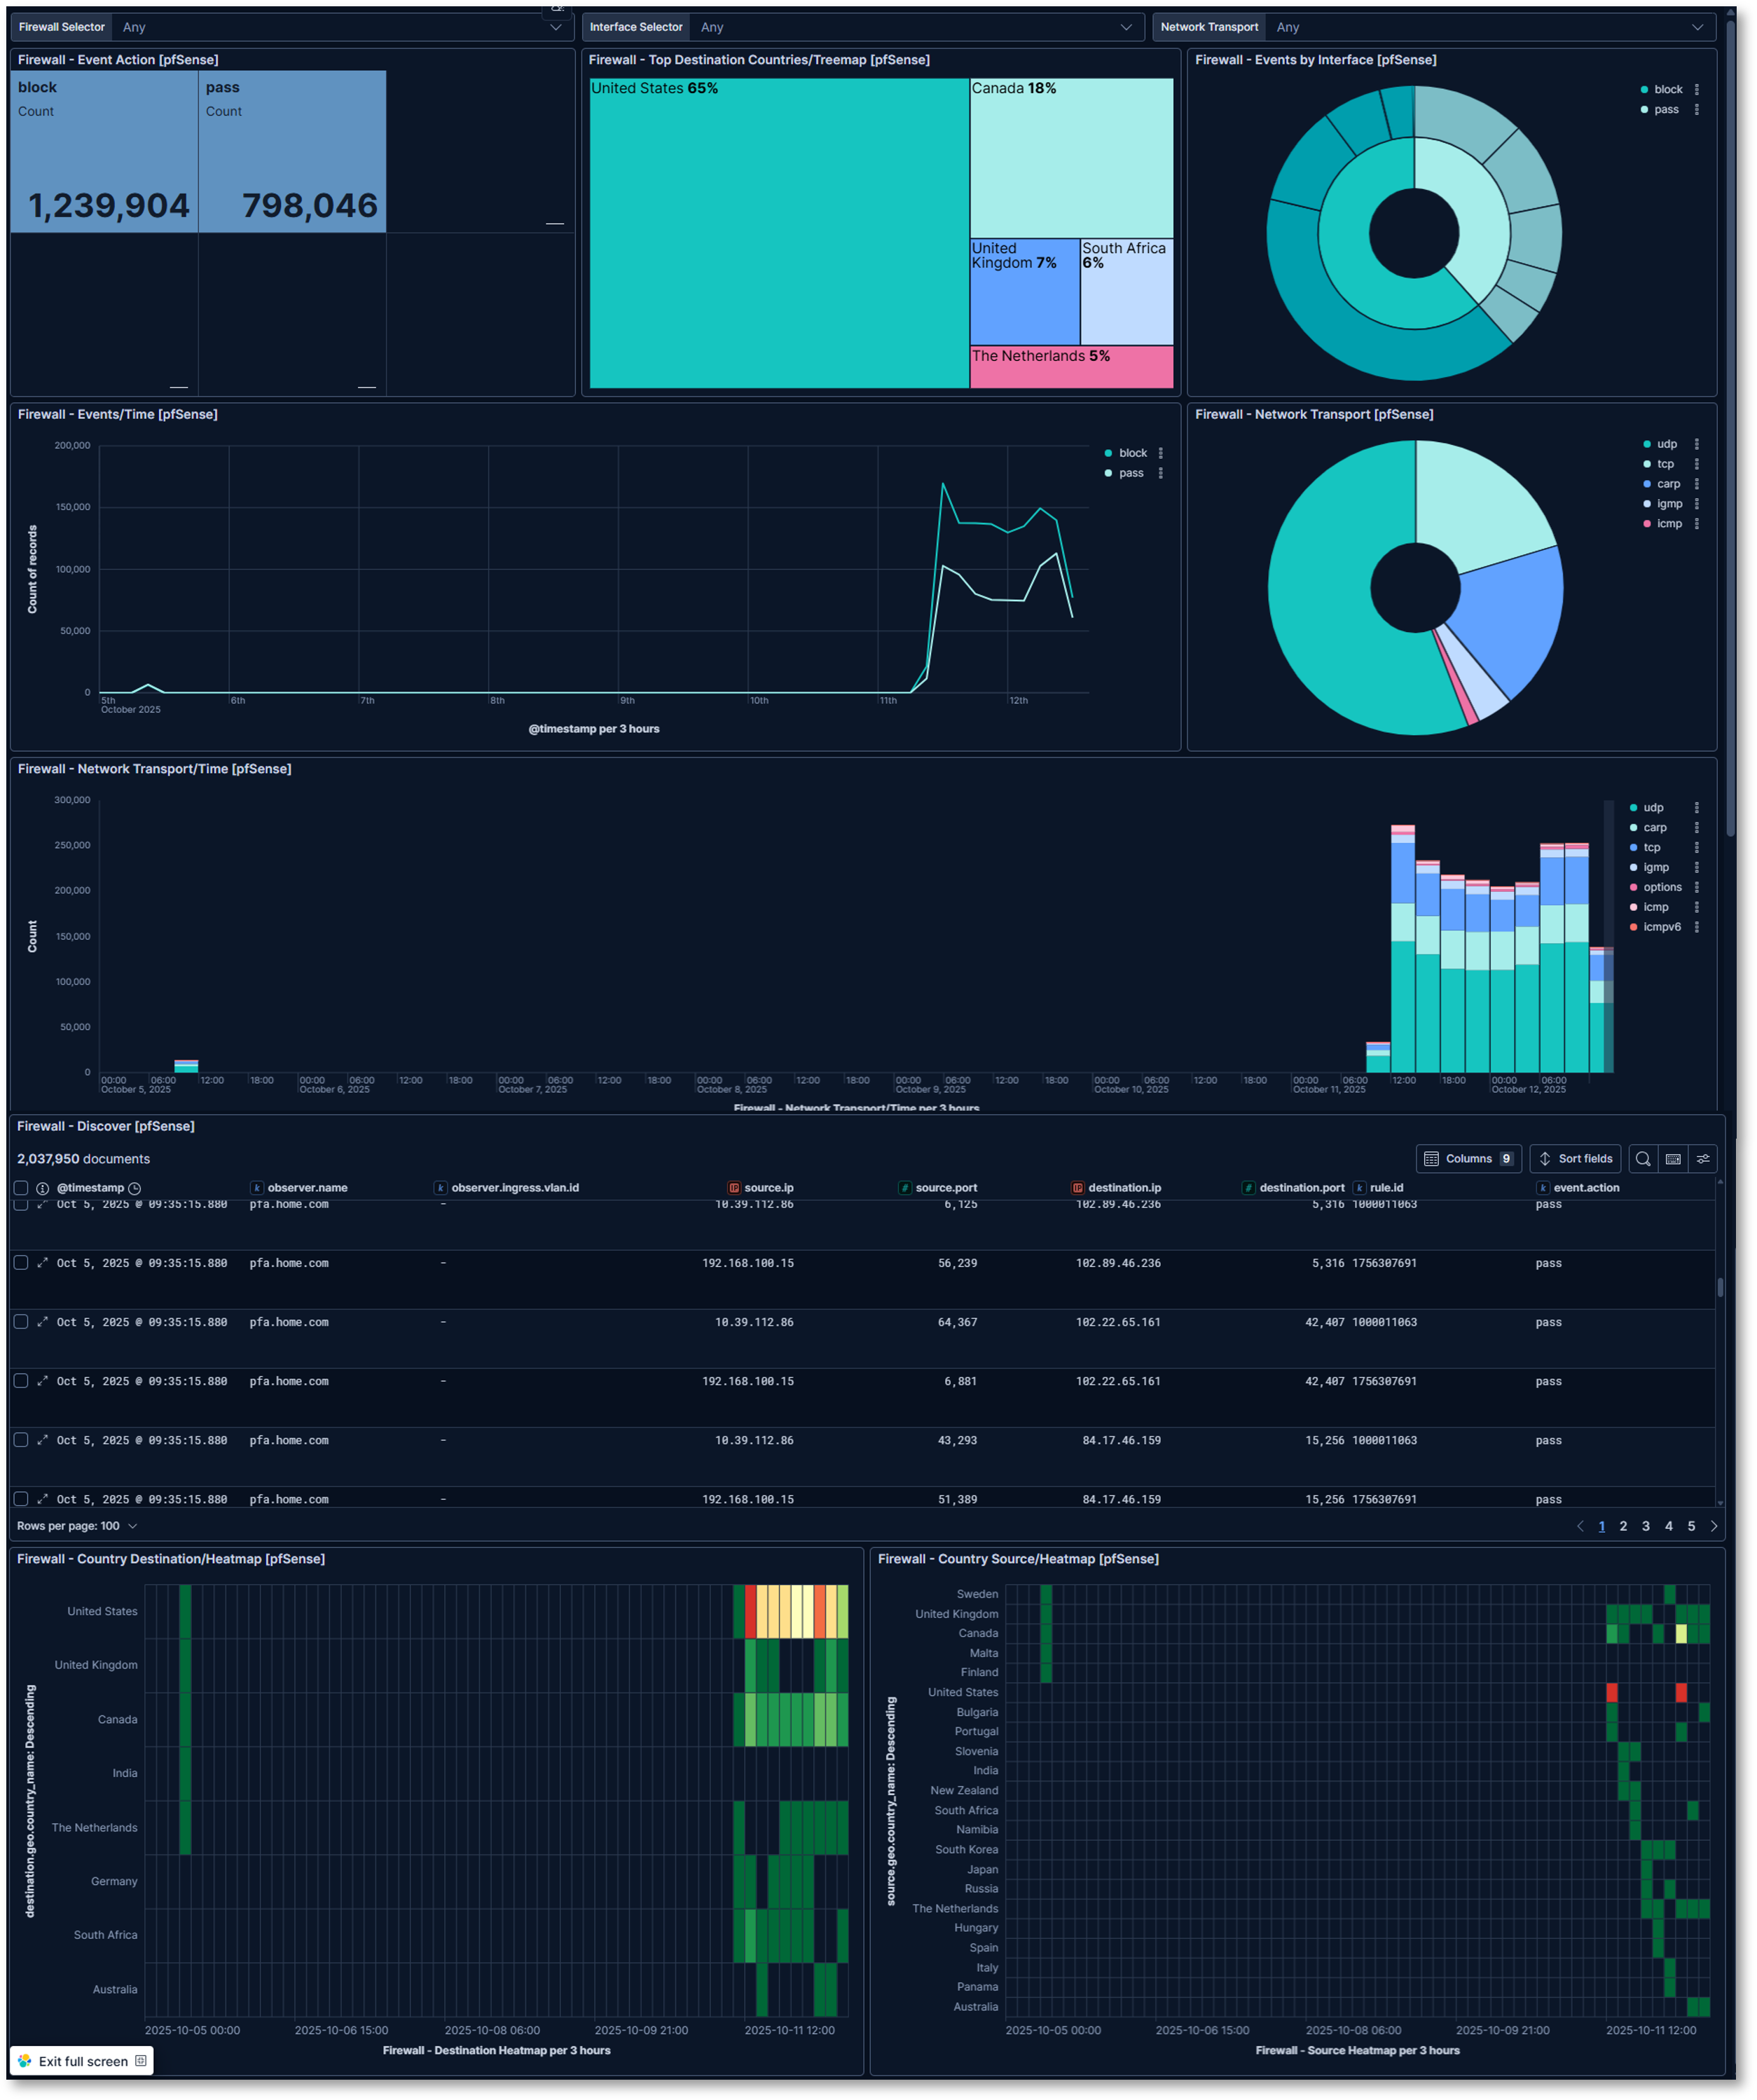
pfSense Firewall Filter Log and Location Dashboard:
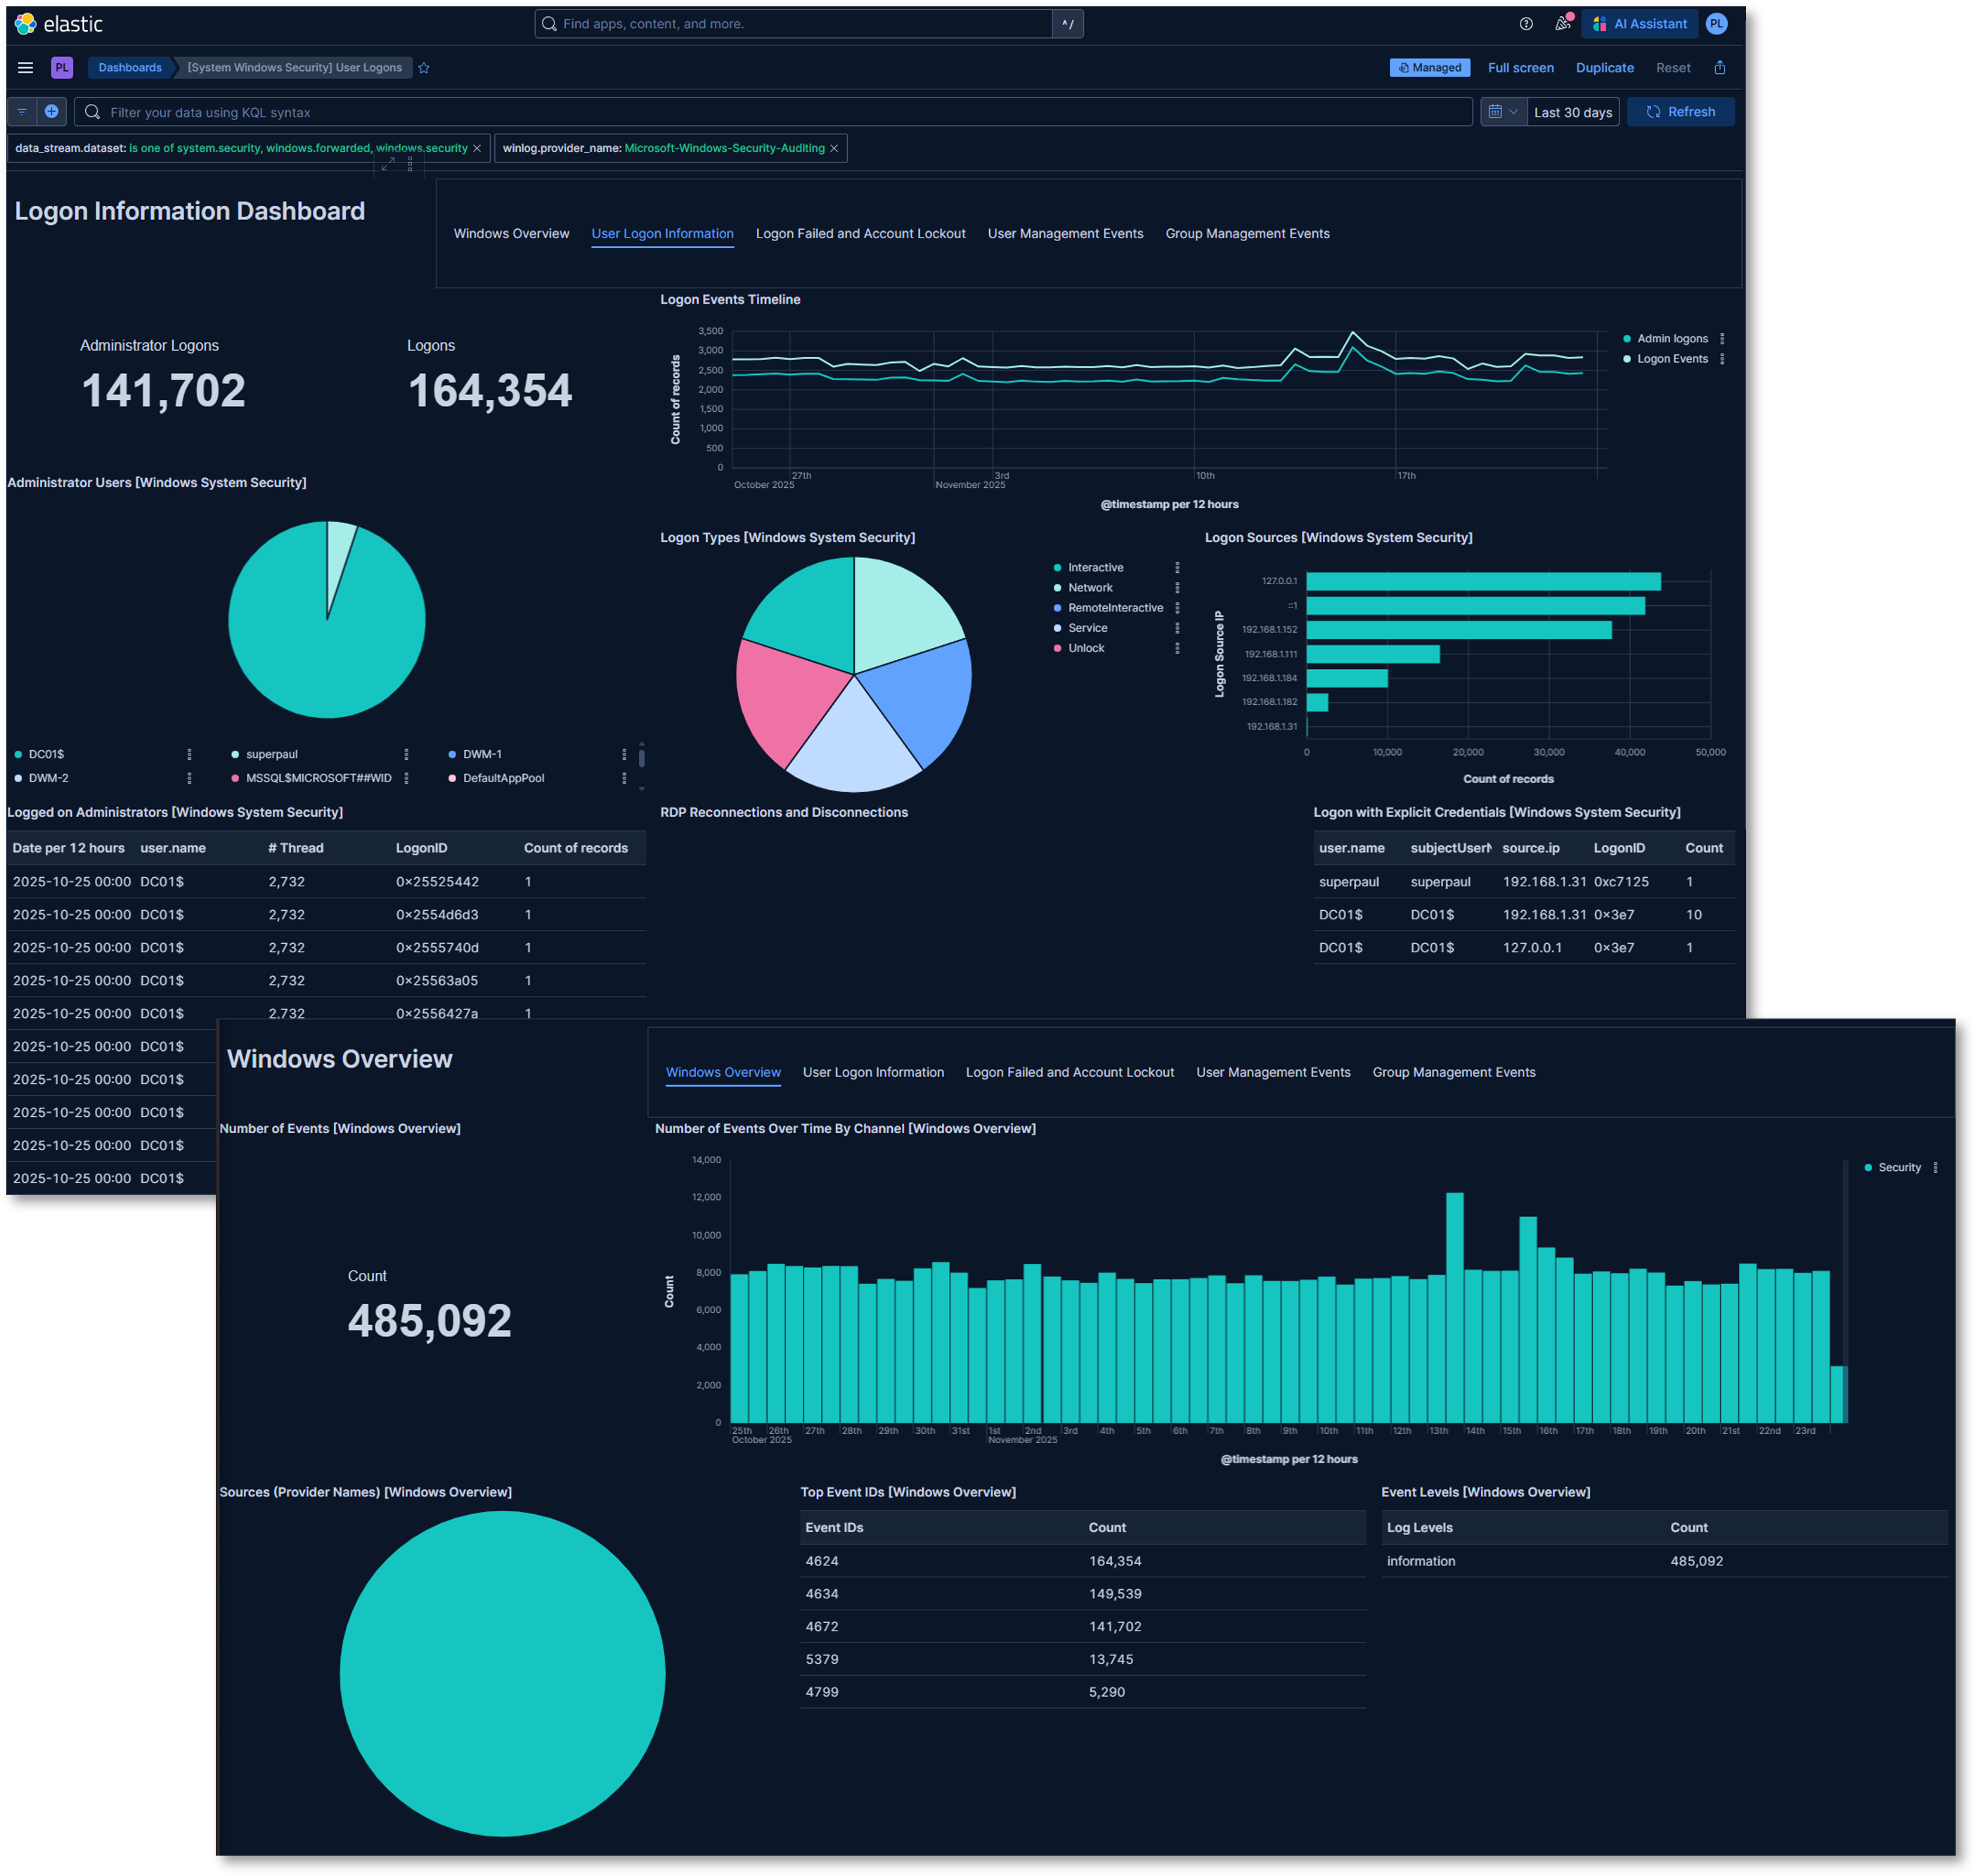
Windows Overview and Security Dashboards:
Visualizations:
- Number of events
- Top Event IDs
- Number of Events Over Time by Channel: Bar chart of events by date
- Total Administrator and standard logins
- Login Event Timeline: Line graph of administrator and standard login events
- Administrator Users: Pie chart of logins by account
- Login Types: Pie chart of the login event by type
- Login Sources: Bar chart of the logins by source IP
- Login events: Table of login event by account, source IP and threads
4. Wazuh Endpoint Detection and Response (EDR)
Deployment Overview
Wazuh provides host-based security monitoring, threat detection, and compliance auditing across Windows, Linux, BSD, and macOS endpoints. The platform combines SIEM-style log analysis with EDR-grade telemetry to deliver comprehensive endpoint visibility. Wazuh Agents collect file integrity data, vulnerability information, authentication logs, and system events, forwarding them to a centralized Wazuh Manager for correlation and alerting.
Security Impact
Wazuh strengthens endpoint security by detecting unauthorized file changes, rootkits, suspicious processes, and privilege escalation attempts. File Integrity Monitoring (FIM) provides early detection of tampering with critical system files, while rootkit detection identifies hidden processes and kernel-level threats. Vulnerability assessment scans endpoints for missing patches and known CVEs, and Security Configuration Assessment (SCA) enforces CIS benchmark compliance.
Deployment Rationale
Endpoint compromise remains one of the most common initial access vectors in modern attacks. Wazuh provides essential host-level visibility and automated response capabilities that complement network-based and SIEM-based detection. Its multi-OS support ensures consistent monitoring across heterogeneous environments.
Architecture Principles Alignment
Defense in Depth:
- Adds endpoint-layer detection to complement network, identity, and application telemetry
- FIM, rootkit detection, and vulnerability scanning provide overlapping security controls
- Active Response automates containment to reduce dwell time
Secure by Design:
- CIS benchmark audits enforce hardened configurations
- SCA policies detect deviations from approved security baselines
- VirusTotal integration validates suspicious artifacts
Zero Trust:
- No endpoint activity is implicitly trusted
- Continuous monitoring ensures every process, file change, and authentication event is observable
- Automated containment actions enforce least-privilege
Component Architecture
Deployment Model: Single-node manager running on an LXC, distributed agents
Components:
- Wazuh Manager: Core analysis and correlation engine
- Wazuh Indexer: Stores and indexes security events
- Wazuh Dashboard: Web UI for search, visualization, and alert management
- Agents: Installed on monitored endpoints
- Splunk Universal Forwarder: Log export for system-wide normalization and correlation
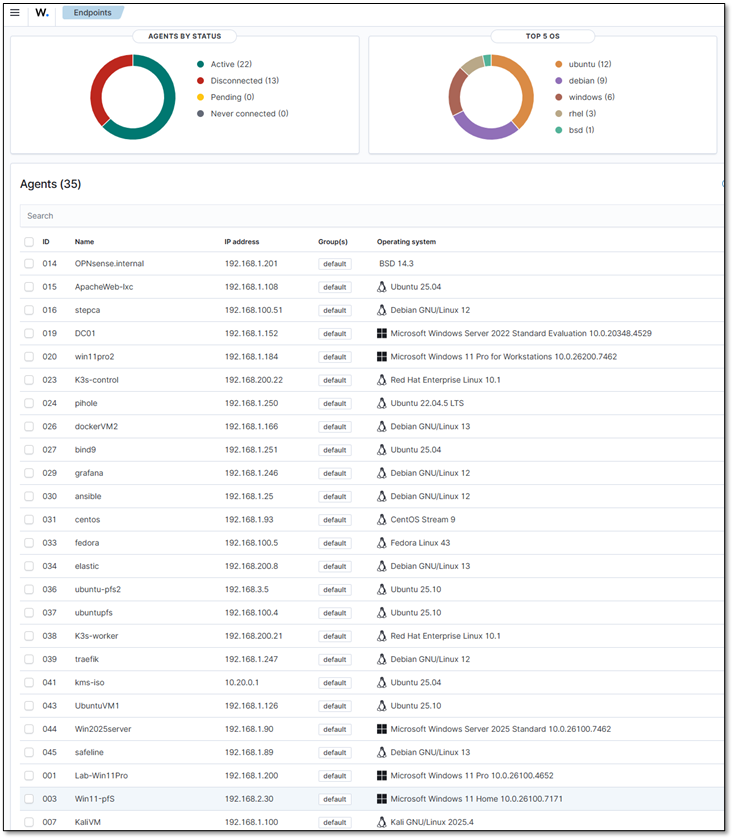
Agent List
| ID | Name | IP address | OS Platform and Release |
|---|---|---|---|
| 0 | wazuh | 127.0.0.1 | Debian GNU/Linux, 12 (bookworm) |
| 1 | Lab-Win11Pro | 192.168.1.200 | Microsoft Windows 11 Pro, 10.0.26100.4652 (N/A) |
| 3 | Win11-pfS | 192.168.2.30 | Microsoft Windows 11 Home, 10.0.26100.7171 (N/A) |
| 7 | KaliVM | 192.168.1.100 | Kali GNU/Linux, 2025.4 (N/A) |
| 13 | Logans-MacBook-Air.local | 192.168.1.207 | macOS, 14.7.8 (Sonoma) |
| 14 | OPNsense.internal | 192.168.1.201 | FreeBSD, 14.3 (N/A) |
| 15 | ApacheWeb-lxc | 192.168.1.108 | Ubuntu, 25.04 (Plucky Puffin) |
| 16 | stepca | 192.168.100.51 | Debian GNU/Linux, 12 (bookworm) |
| 17 | Win11Pro | 192.168.1.111 | Microsoft Windows 11 Pro, 10.0.26100.7462 (N/A) |
| 18 | UbuntuGenVM | 192.168.1.126 | Ubuntu, 25.1 (Questing Quokka) |
| 19 | DC01 | 192.168.1.152 | Microsoft Windows Server 2022 Standard Evaluation, 10.0.20348.4529 (N/A) |
| 20 | win11pro2 | 192.168.1.184 | Microsoft Windows 11 Pro for Workstations, 10.0.26200.7462 (N/A) |
| 21 | Plex-lxc | 192.168.1.136 | Ubuntu, 22.04.5 LTS (Jammy Jellyfish) |
| 22 | redhat-control | 192.168.200.21 | Red Hat Enterprise Linux, 10 (Coughlan) |
| 23 | K3s-control | 192.168.200.22 | Red Hat Enterprise Linux, 10.1 (Coughlan) |
| 24 | pihole | 192.168.1.250 | Ubuntu, 22.04.5 LTS (Jammy Jellyfish) |
| 26 | dockerVM2 | 192.168.1.166 | Debian GNU/Linux, 13 (trixie) |
| 27 | bind9 | 192.168.1.251 | Ubuntu, 25.04 (Plucky Puffin) |
| 28 | unbound | 192.168.1.252 | Ubuntu, 22.04.5 LTS (Jammy Jellyfish) |
| 29 | grafana | 192.168.1.246 | Debian GNU/Linux, 12 (bookworm) |
| 30 | ansible | 192.168.1.25 | Debian GNU/Linux, 12 (bookworm) |
| 31 | centos | 192.168.1.93 | CentOS Stream, 9 (N/A) |
| 32 | splunk | 192.168.1.109 | Ubuntu, 24.1 (Oracular Oriole) |
| 33 | fedora | 192.168.100.5 | Fedora Linux, 43 (Server Edition) |
| 34 | elastic | 192.168.200.8 | Debian GNU/Linux, 13 (trixie) |
| 35 | Ubuntu-pfLAN | 192.168.2.7 | Ubuntu, 25.1 (Questing Quokka) |
| 36 | ubuntu-pfs2 | 192.168.3.5 | Ubuntu, 25.1 (Questing Quokka) |
| 37 | ubuntupfs | 192.168.100.4 | Ubuntu, 25.1 (Questing Quokka) |
| 38 | K3s-worker | 192.168.200.21 | Red Hat Enterprise Linux, 10.1 (Coughlan) |
| 39 | traefik | 192.168.1.247 | Debian GNU/Linux, 12 (bookworm) |
| 40 | debian-Extlan | 192.168.2.5 | Debian GNU/Linux, 12 (bookworm) |
| 41 | kms-iso | 10.20.0.1 | Ubuntu, 25.04 (Plucky Puffin) |
| 42 | parrotOS | 192.168.100.16 | Parrot Security, 7.1 (echo) |
| 43 | UbuntuVM1 | 192.168.1.126 | Ubuntu, 25.1 (Questing Quokka) |
| 44 | Win2025server | 192.168.1.90 | Microsoft Windows Server 2025 Standard, 10.0.26100.7462 (N/A) |
| 45 | safeline | 192.168.1.89 | Debian GNU/Linux, 13 (trixie) |
Security Monitoring Modules
File Integrity Monitoring (FIM)
Purpose: Detect unauthorized changes to critical system files and attacker-target directories
Configuration:
- Real-time monitoring: Enabled for critical paths and high-risk directories
- Linux: /root, /tmp, /var/tmp, /home/*/Downloads
- Windows: C:\Users*\Downloads, C:\Windows\Temp, C:\Temp, C:\Users*\AppData\Local\Temp
- Scheduled scans: Every 12 hours for full filesystem baseline
- Hash algorithms: MD5, SHA1, SHA256
- Attributes tracked: Size, permissions, ownership, mtime
- Alert on: Creation, modification, deletion
Example FIM Alerts:
- Description: New file created in /tmp
- File: /tmp/malicious.sh
-
Action: Alert + snapshot of file metadata
-
Description: Integrity checksum changed
- File: C:\Windows\System32\drivers\etc\hosts
- Old MD5: abc123...
- New MD5: def456...
- Action: Alert + snapshot of file content
<!-- File Integrity Monitoring -->
  <syscheck>
    <disabled>no</disabled>
    <frequency>43200</frequency>
    <scan_on_start>yes</scan_on_start>
    <alert_new_files>yes</alert_new_files>
    <auto_ignore frequency="10" timeframe="3600">no</auto_ignore>

    <!-- Critical system dirs -->
    <directories realtime="yes">/etc</directories>
    <directories realtime="yes">/usr/bin</directories>
    <directories realtime="yes">/usr/sbin</directories>
    <directories realtime="yes">/bin</directories>
    <directories realtime="yes">/sbin</directories>
    <directories realtime="yes">/boot</directories>
    <directories realtime="yes">C:\Windows\System32</directories>

    <!-- Threat actor targets -->
    <directories realtime="yes">/root</directories>
    <directories realtime="yes">/var/tmp</directories>
    <directories realtime="yes">/home/*/Downloads</directories>
    <directories realtime="yes">C:\Users\*\Downloads</directories>
    <directories realtime="yes">C:\Temp</directories>
    <directories realtime="yes">C:\Users\*\AppData\Local\Temp</directories>

    <!-- Ignore noise -->
    <ignore>/etc/mtab</ignore>
    <ignore type="sregex">.log$|.swp$</ignore>
    <nodiff>/etc/ssl/private.key</nodiff>

    <skip_nfs>yes</skip_nfs>
    <skip_dev>yes</skip_dev>
    <skip_proc>yes</skip_proc>
    <skip_sys>yes</skip_sys>

    <process_priority>10</process_priority>
    <max_eps>50</max_eps>

    <synchronization>
      <enabled>yes</enabled>
      <interval>5m</interval>
      <max_eps>10</max_eps>
    </synchronization>
  </syscheck>
Rootkit Detection
Purpose: Identify hidden processes, ports, and kernel modules
Checks Performed:
- Hidden processes: Compare ps output with /proc
- Hidden ports: Netstat vs /proc/net/* comparison
- Kernel modules: Verify against known-good list
- System binaries: Check for trojaned ls, ps, netstat
- Registry anomalies: Windows registry rootkits
Vulnerability Assessment
Purpose: Identify missing patches and known CVEs
Vulnerability Sources:
- Windows: Microsoft Security Update Guide (MSU)
- Red Hat/CentOS: OVAL feeds
- Debian/Ubuntu: Debian Security Tracker
- macOS: Apple Security Updates
Example Vulnerability Alert:
- CVE: CVE-2024-43451
- Title: NTLM Hash Disclosure Vulnerability
- CVSS: 8.1 (High)
- Affected: Windows Server 2022 DC01
- Package: ntlm.dll version 10.0.20348.2227
- Fix Available: Yes (KB5043936)
- Recommendation: Apply security update immediately
Security Configuration Assessment (SCA)
Purpose: Audit compliance with security benchmarks
Policies Applied:
- CIS Windows Server 2022 Benchmark
- CIS Windows 11 Benchmark
- CIS Debian 12 Benchmark
- CIS Debian 13 Benchmark
- CIS Ubuntu 22.04 LTS Benchmark
- CIS Red Hat Enterprise Linux 10 Benchmark
- CIS CentOS Linux 9 Benchmark
- CIS Distribution Independent Linux Benchmark v2.0.0
- CIS Apache 2.4 Benchmark
- PCI-DSS v4.0 requirements
- NIST 800-53 controls
Example SCA Finding:
- Policy: CIS Windows Server 2022
- Check ID: 2.3.10.5
- Title: Network access: Do not allow storage of passwords and credentials
- Status: FAIL
- Current Value: Enabled
- Expected Value: Disabled
- Remediation: Set HKLM\SYSTEM\CurrentControlSet\Control\Lsa\DisableDomainCreds to 1
- Severity: High
Login Monitoring (SSH/RDP)
Purpose: Detect brute force attempts and unauthorized remote access
Configuration:
- Linux: Monitor /var/log/auth.log for failed SSH login attempts
- Windows: Monitor Security event channel for Event ID 4625 (failed RDP logins)
- Thresholds: Multiple failed attempts within a short timeframe trigger high-severity alerts
Example Alert:
- Rule ID: 5710
- Description: Multiple failed SSH login attempts detected
- Source IP: 192.168.3.45
- Action: Alert + optional active response (firewall drop)
Active Response
Firewall Drop
Command:
<command>
  <name>firewall-drop</name>
  <executable>firewall-drop</executable>
  <expect>srcip</expect>
  <timeout_allowed>yes</timeout_allowed>
</command>
Active Response:
<active-response>
  <command>firewall-drop</command>
  <location>any</location>
  <rules_group>authentication_failed,sshd</rules_group>
  <timeout>600</timeout>
</active-response>
- Alerts/Trigger: Fires when rules in the authentication_failed or sshd groups are triggered
- Workflow: Wazuh passes the offending source IP (srcip) to the firewall-drop script, which inserts an iptables rule to block traffic. After 600 seconds, the block is lifted.
- Benefit: Immediate containment of brute-force attackers
Host Deny
Command:
<command>
  <name>host-deny</name>
  <executable>host-deny</executable>
  <expect>srcip</expect>
  <timeout_allowed>yes</timeout_allowed>
</command>
Active Response:
<active-response>
  <command>host-deny</command>
  <location>any</location>
  <rules_group>authentication_failed</rules_group>
  <timeout>600</timeout>
</active-response>
- Alerts/Trigger: Activated on authentication_failed events
- Workflow: The offending IP is added to /etc/hosts.deny. After 600 seconds, the entry is removed.
- Benefit: Lightweight containment using TCP wrappers
Disable Account
Command:
<command>
  <name>disable-account</name>
  <executable>disable-account</executable>
  <expect>user</expect>
  <timeout_allowed>no</timeout_allowed>
</command>
Active Response:
<active-response>
  <command>disable-account</command>
  <location>local</location>
  <rules_group>authentication_failed</rules_group>
</active-response>
- Alerts/Trigger: Fires when a local user repeatedly fails authentication
- Workflow: Wazuh passes the username to the disable-account script, which locks the account immediately
- Benefit: Prevents compromised or brute-forced accounts from being abused
Integrations
Splunk
Log Forwarding Configuration:
Wazuh Manager → Splunk Universal Forwarder → Splunk Indexer
Forwarder Configuration (inputs.conf):
[monitor:///var/ossec/logs/alerts/alerts.json]
disabled = false
sourcetype = wazuh:alerts
index = wazuh-alerts
source = wazuh-manager
Alert Enrichment in Splunk:
- MITRE ATT&CK Mapping: Techniques and tactics
- Asset Context: Host criticality, owner, location
- Threat Intelligence: IOC matching from feeds
- User Context: AD user attributes, group membership
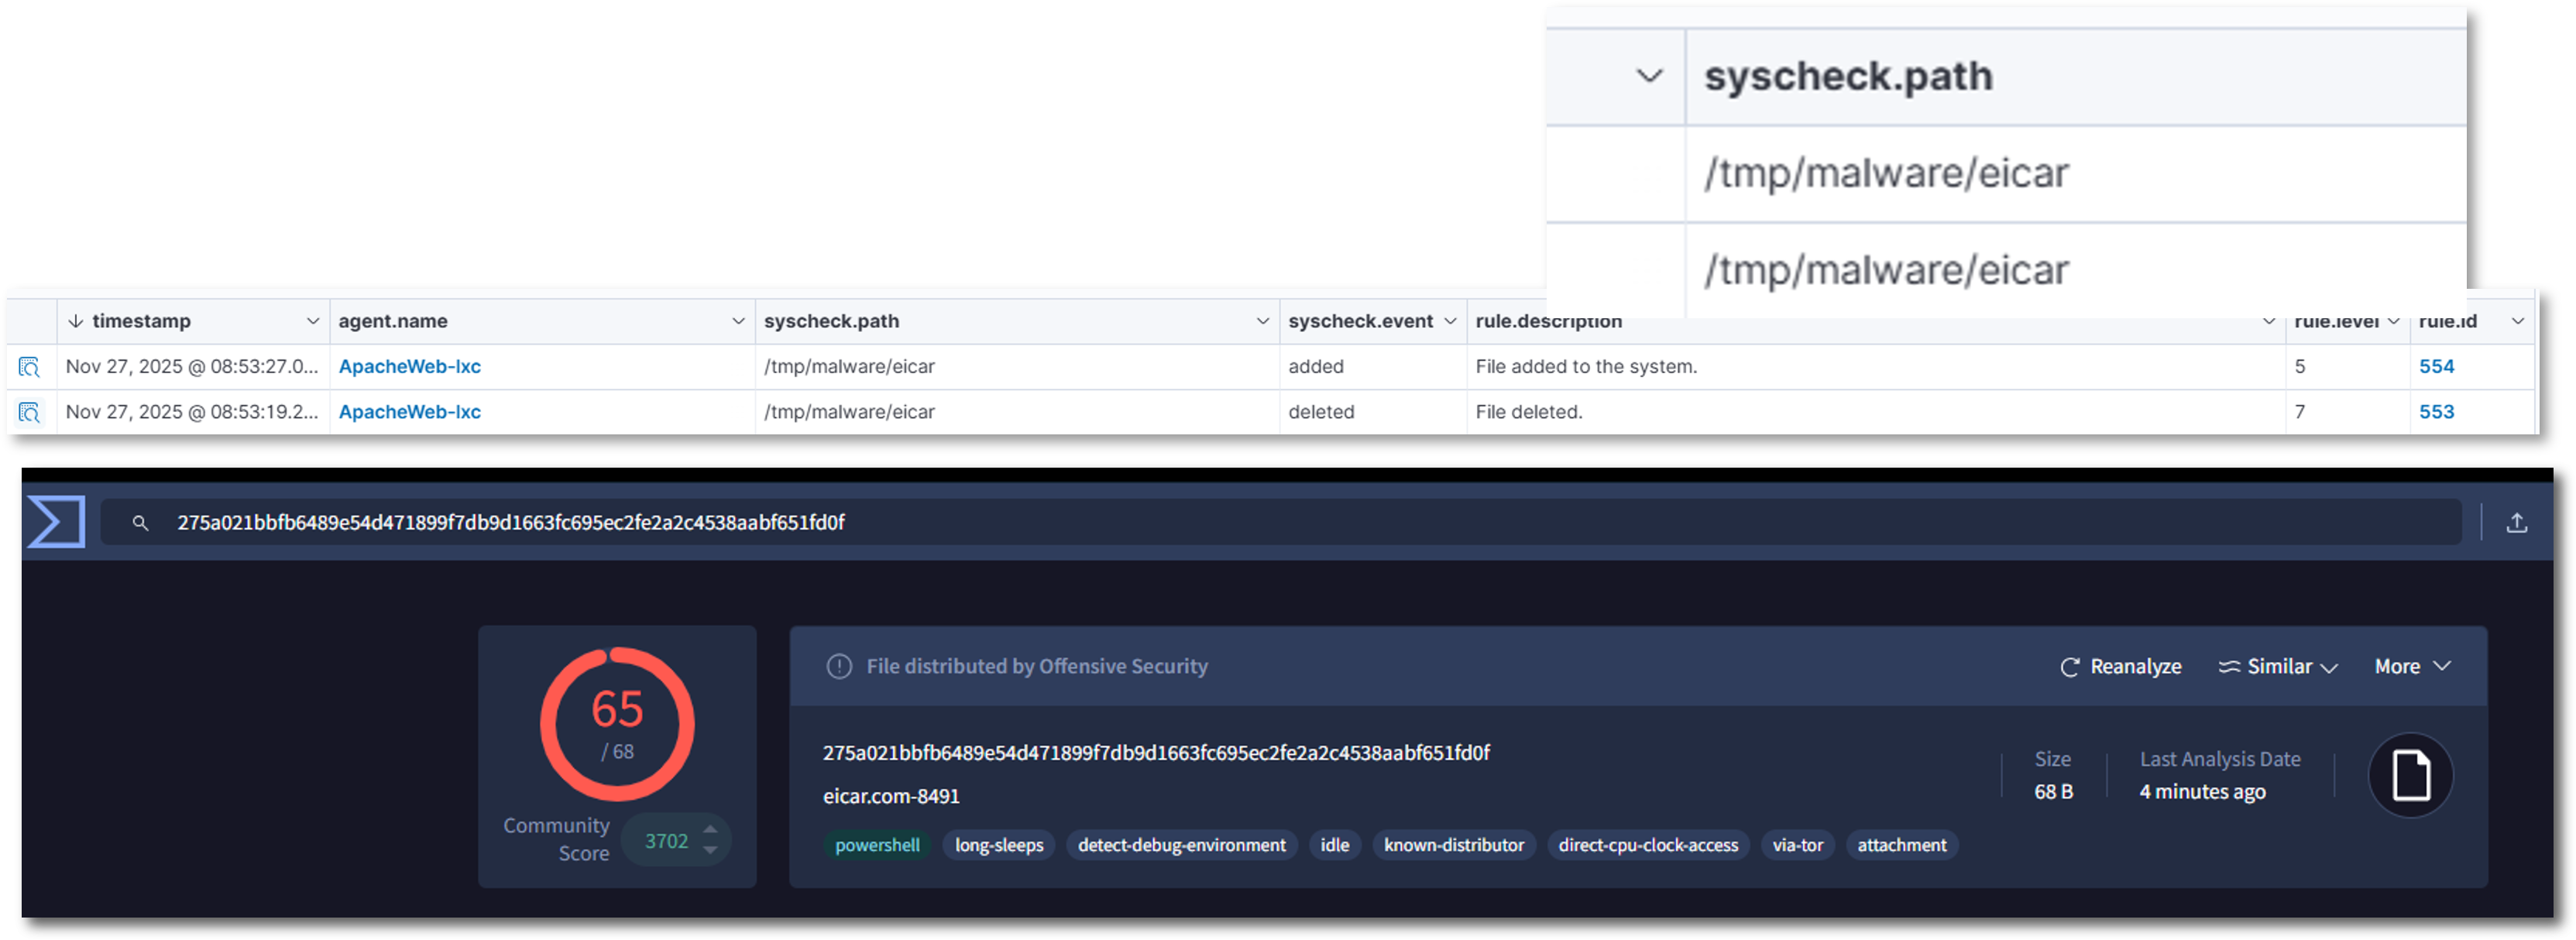
VirusTotal
VirusTotal is integrated into the File Integrity Monitoring workflow through a custom rule that targets new or modified executable and script files.
- Scope: Applies to File Integrity Monitoring events involving executable and script files in monitored directories
- Trigger: Custom rule_id 87105 fires when VirusTotal reports multiple positive detections
- Action: Host-level Bash script is invoked automatically to quarantine or remove the flagged file
- Benefit: Only suspicious binaries are escalated; preserves VirusTotal API quota
Configuration:
<integration>
  <name>virustotal</name>
  <api_key>xxxxxxxxxxxxxxxxxxx</api_key>
  <rule_id>100003</rule_id>
  <alert_format>json</alert_format>
</integration>

<command>
  <name>remove-threat</name>
  <executable>remove-threat.sh</executable>
  <timeout_allowed>no</timeout_allowed>
</command>

<active-response>
  <disabled>no</disabled>
  <command>remove-threat</command>
  <location>local</location>
  <rules_id>87105</rules_id>
</active-response>
Discord
External alerting to Discord has been configured for specific workflows. Alerts from the sshd, authentication_failure, or syscheck_file groups trigger a custom script that sends a message to a Discord webhook in the #wazuh channel.
- Scope: Alerts generated by sshd, authentication_failure, syscheck_file groups
- Trigger: When any of these groups fire, Wazuh's active response mechanism invokes a custom Bash script
- Action: The script formats the alert into a Discord embed enriched with rule, group, and host metadata
- Benefit: Real-time visibility into critical security events with actionable context
Configuration:
<integration>
  <name>discord</name>
  <hook_url>https://discord.com/api/webhooks/xxxxxxxx</hook_url>
  <group>multiple_drops,authentication_failed,sshd,syscheck_file</group>
  <alert_format>json</alert_format>
</integration>

<command>
  <name>discord</name>
  <executable>discord.sh</executable>
  <expect>json</expect>
  <timeout_allowed>no</timeout_allowed>
</command>

<active-response>
  <disabled>no</disabled>
  <command>discord</command>
  <location>local</location>
  <rules_group>sshd,authentication_failure,syscheck_file</rules_group>
</active-response>
Shuffle SOAR
External alerting to Shuffle SOAR has been configured to automate case creation, enrichment, and downstream workflows. Alerts meeting the defined severity threshold are forwarded to a Shuffle webhook, where a workflow processes and routes the event for further action. Alerts are enriched with rule, agent, and metadata fields before being sent to TheHive or other SOAR components.
Scope Alerts generated by Wazuh with severity ≥ 4 are forwarded to Shuffle for automated processing. This includes, but is not limited to, events from:
sshd— SSH authentication activityauthentication_failure— failed login attemptssyscheck_file— file integrity monitoring changes- Any rule group producing level 4+ alerts
Trigger When an alert meets the configured severity threshold, Wazuh’s integration engine sends the full JSON alert payload to the Shuffle webhook.
Action Inside Shuffle, the workflow performs the following steps:
- Parses the incoming Wazuh alert JSON
- Extracts key metadata fields:
- Rule → rule description and rule ID
- Group → Wazuh rule group classification
- Host → agent name or hostname
- Severity → numeric Wazuh level
- Normalizes and sanitizes fields for TheHive compatibility
- Creates a TheHive Alert using the enriched data
- Routes alerts to additional automations such as:
- Case creation
- Discord/email notifications
- Cortex analyzers
Delivery The enriched alert is delivered to Shuffle via a webhook configured in Wazuh:
<integration>
    <name>shuffle</name>
    <hook_url>https://192.168.200.41/api/v1/hooks/webhook_32c000c1-3d4d-47f2-94d2-f1c76c2f8c35</hook_url>
    <level>4</level>
    <alert_format>json</alert_format>
</integration>
Alerting and Notifications
Purpose: Provide immediate visibility into critical events
Configuration:
Email Alerts (Gmail):
- Wazuh configured to send alerts via local relay (msmtp) → smtp.gmail.com:587
- Alerts delivered to wazuh@shadowitlab.com
Discord Alerts:
- Custom active response script posts alerts to Discord webhook channel
- Triggered on new file creation in monitored directories or multiple failed login attempts
Wazuh Dashboard Analytics
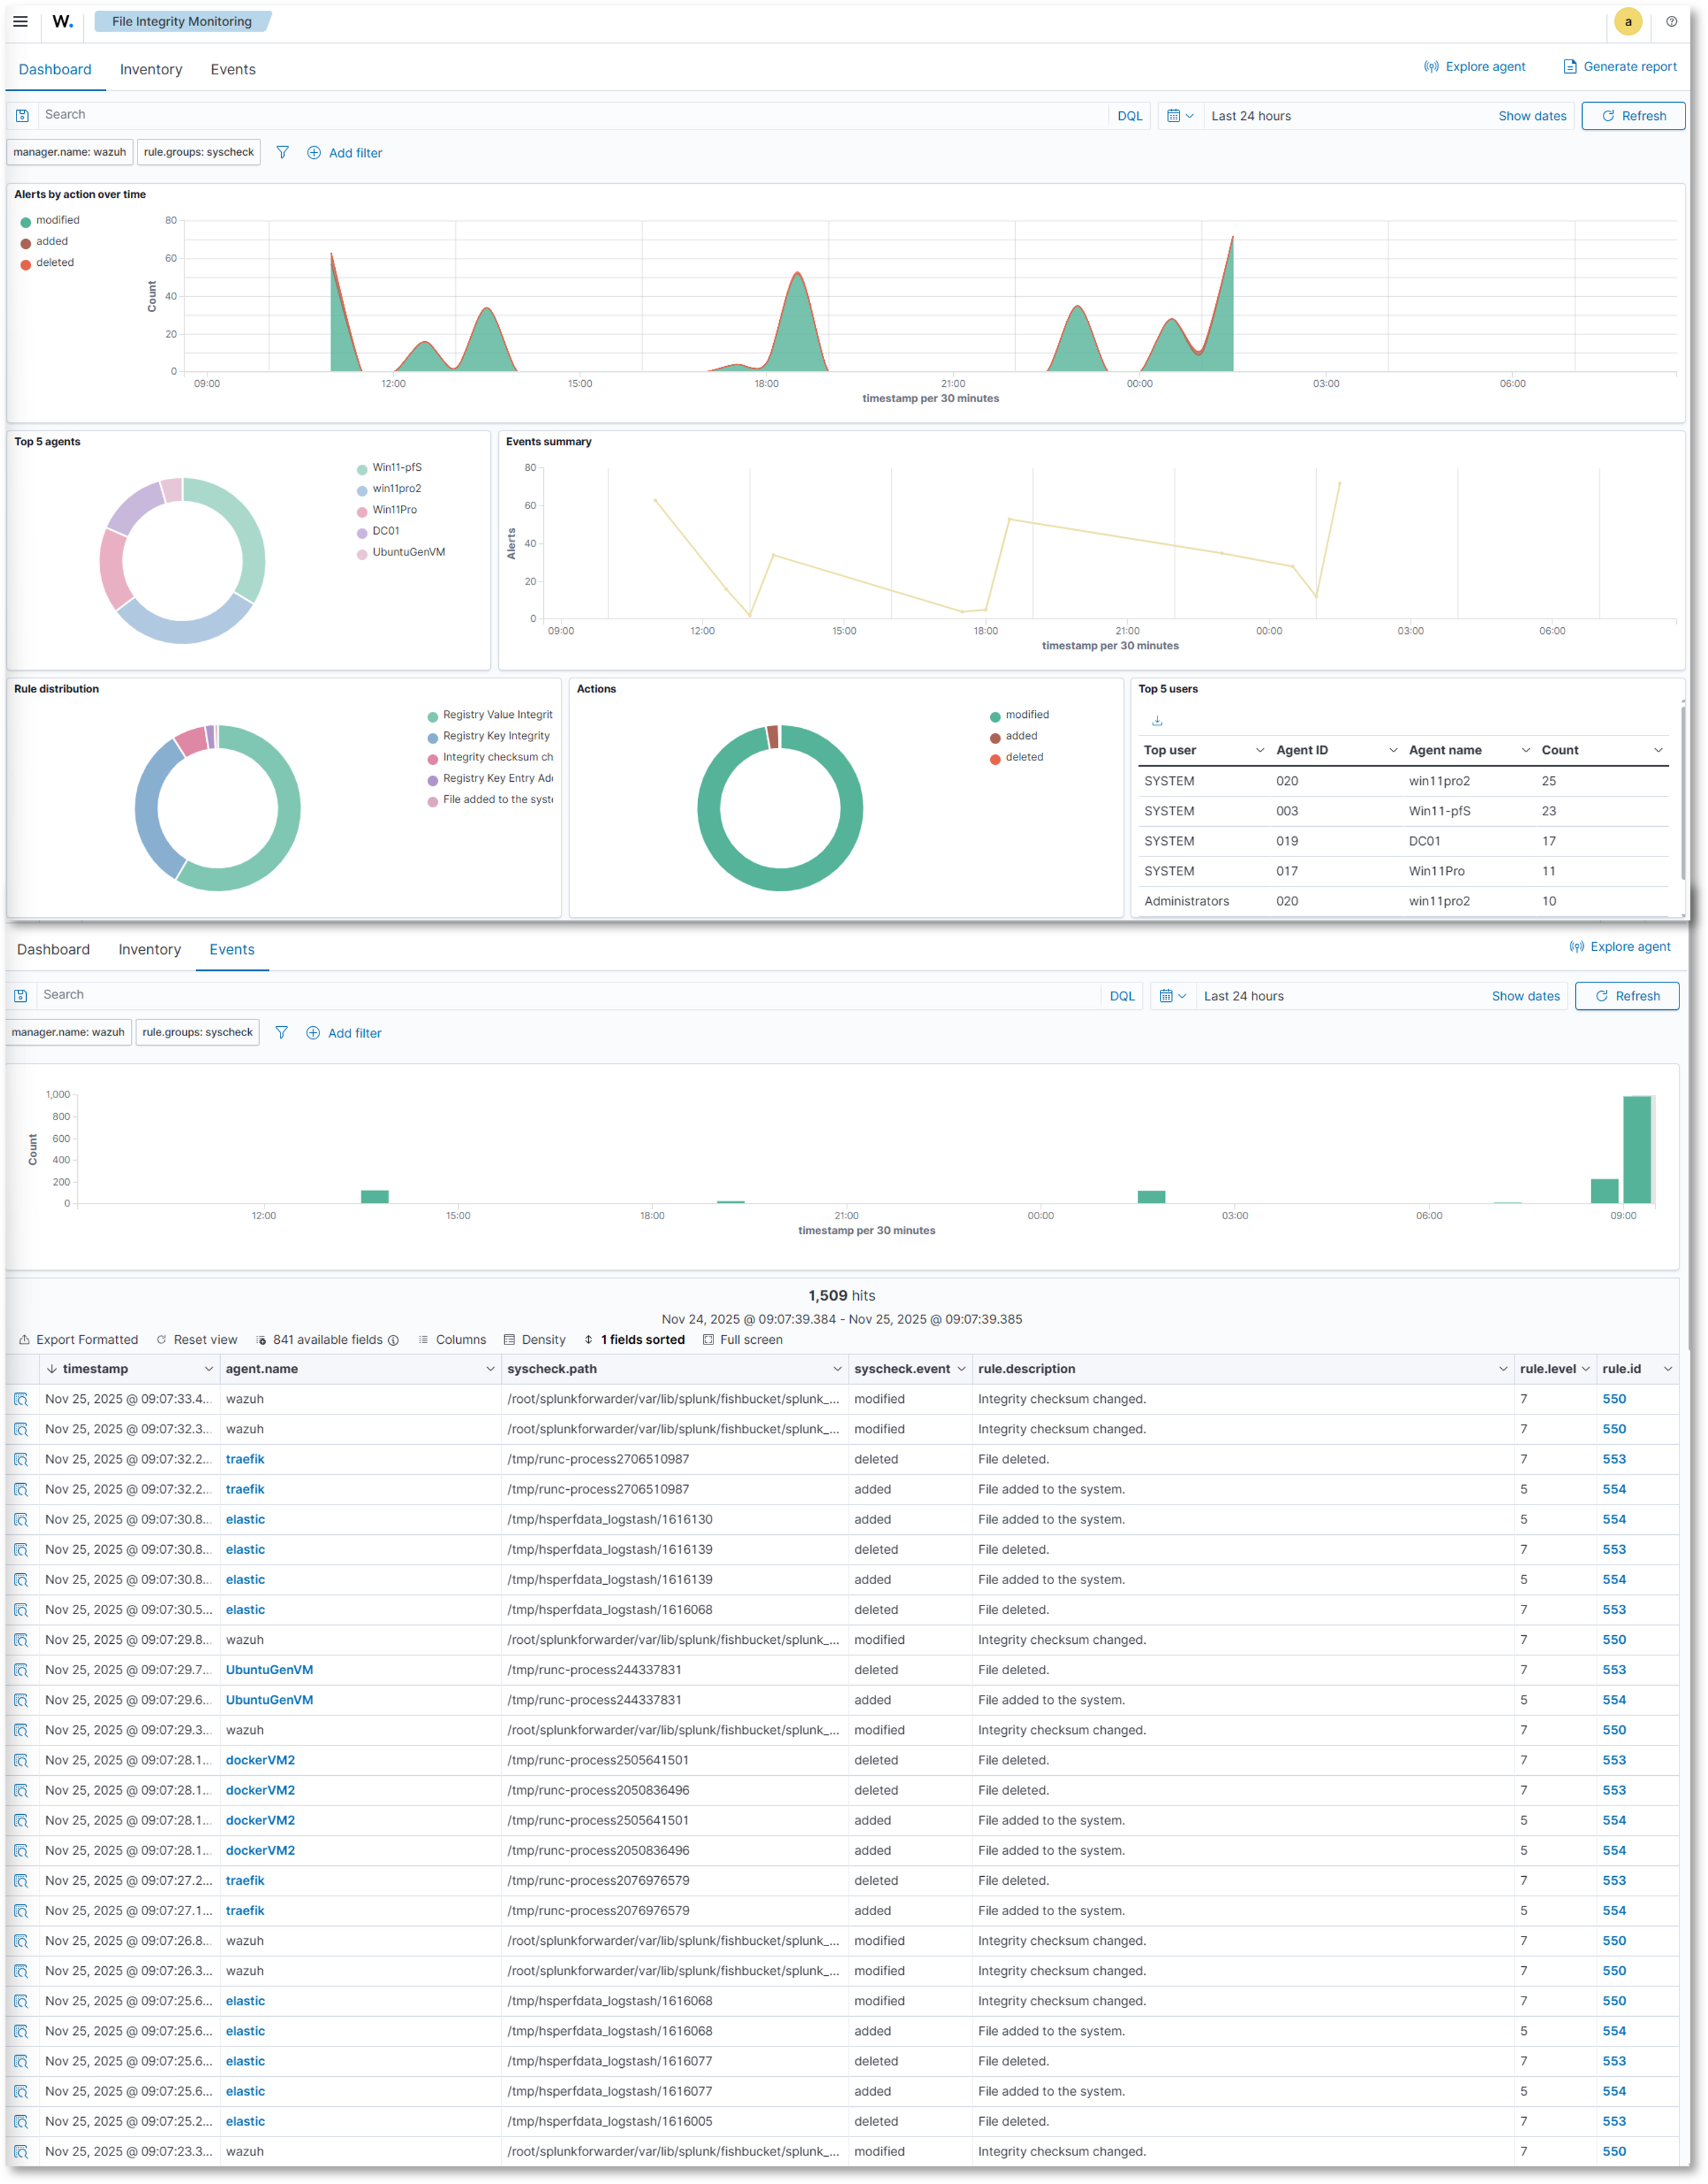
File Integrity Monitoring
Visualizations:
Overview:
- Alerts by action over time: Line chart showing file modifications, additions, and deletions
- Top 5 agents: Donut chart showing the top 5 agents by events
- Rule Distribution: Donut chart showing the events by rule type
- Actions: Donut chart showing events by modification, addition, or deletion action
- Top 5 Users: Table showing the number of events by agent ID
Events:
- Events over time
- Event Summary table showing total events by agent, file, action, and rule information
Inventory:
- Detailed inventory information showing file and registry (Windows) actions including path/key, modification timestamp, user, file size
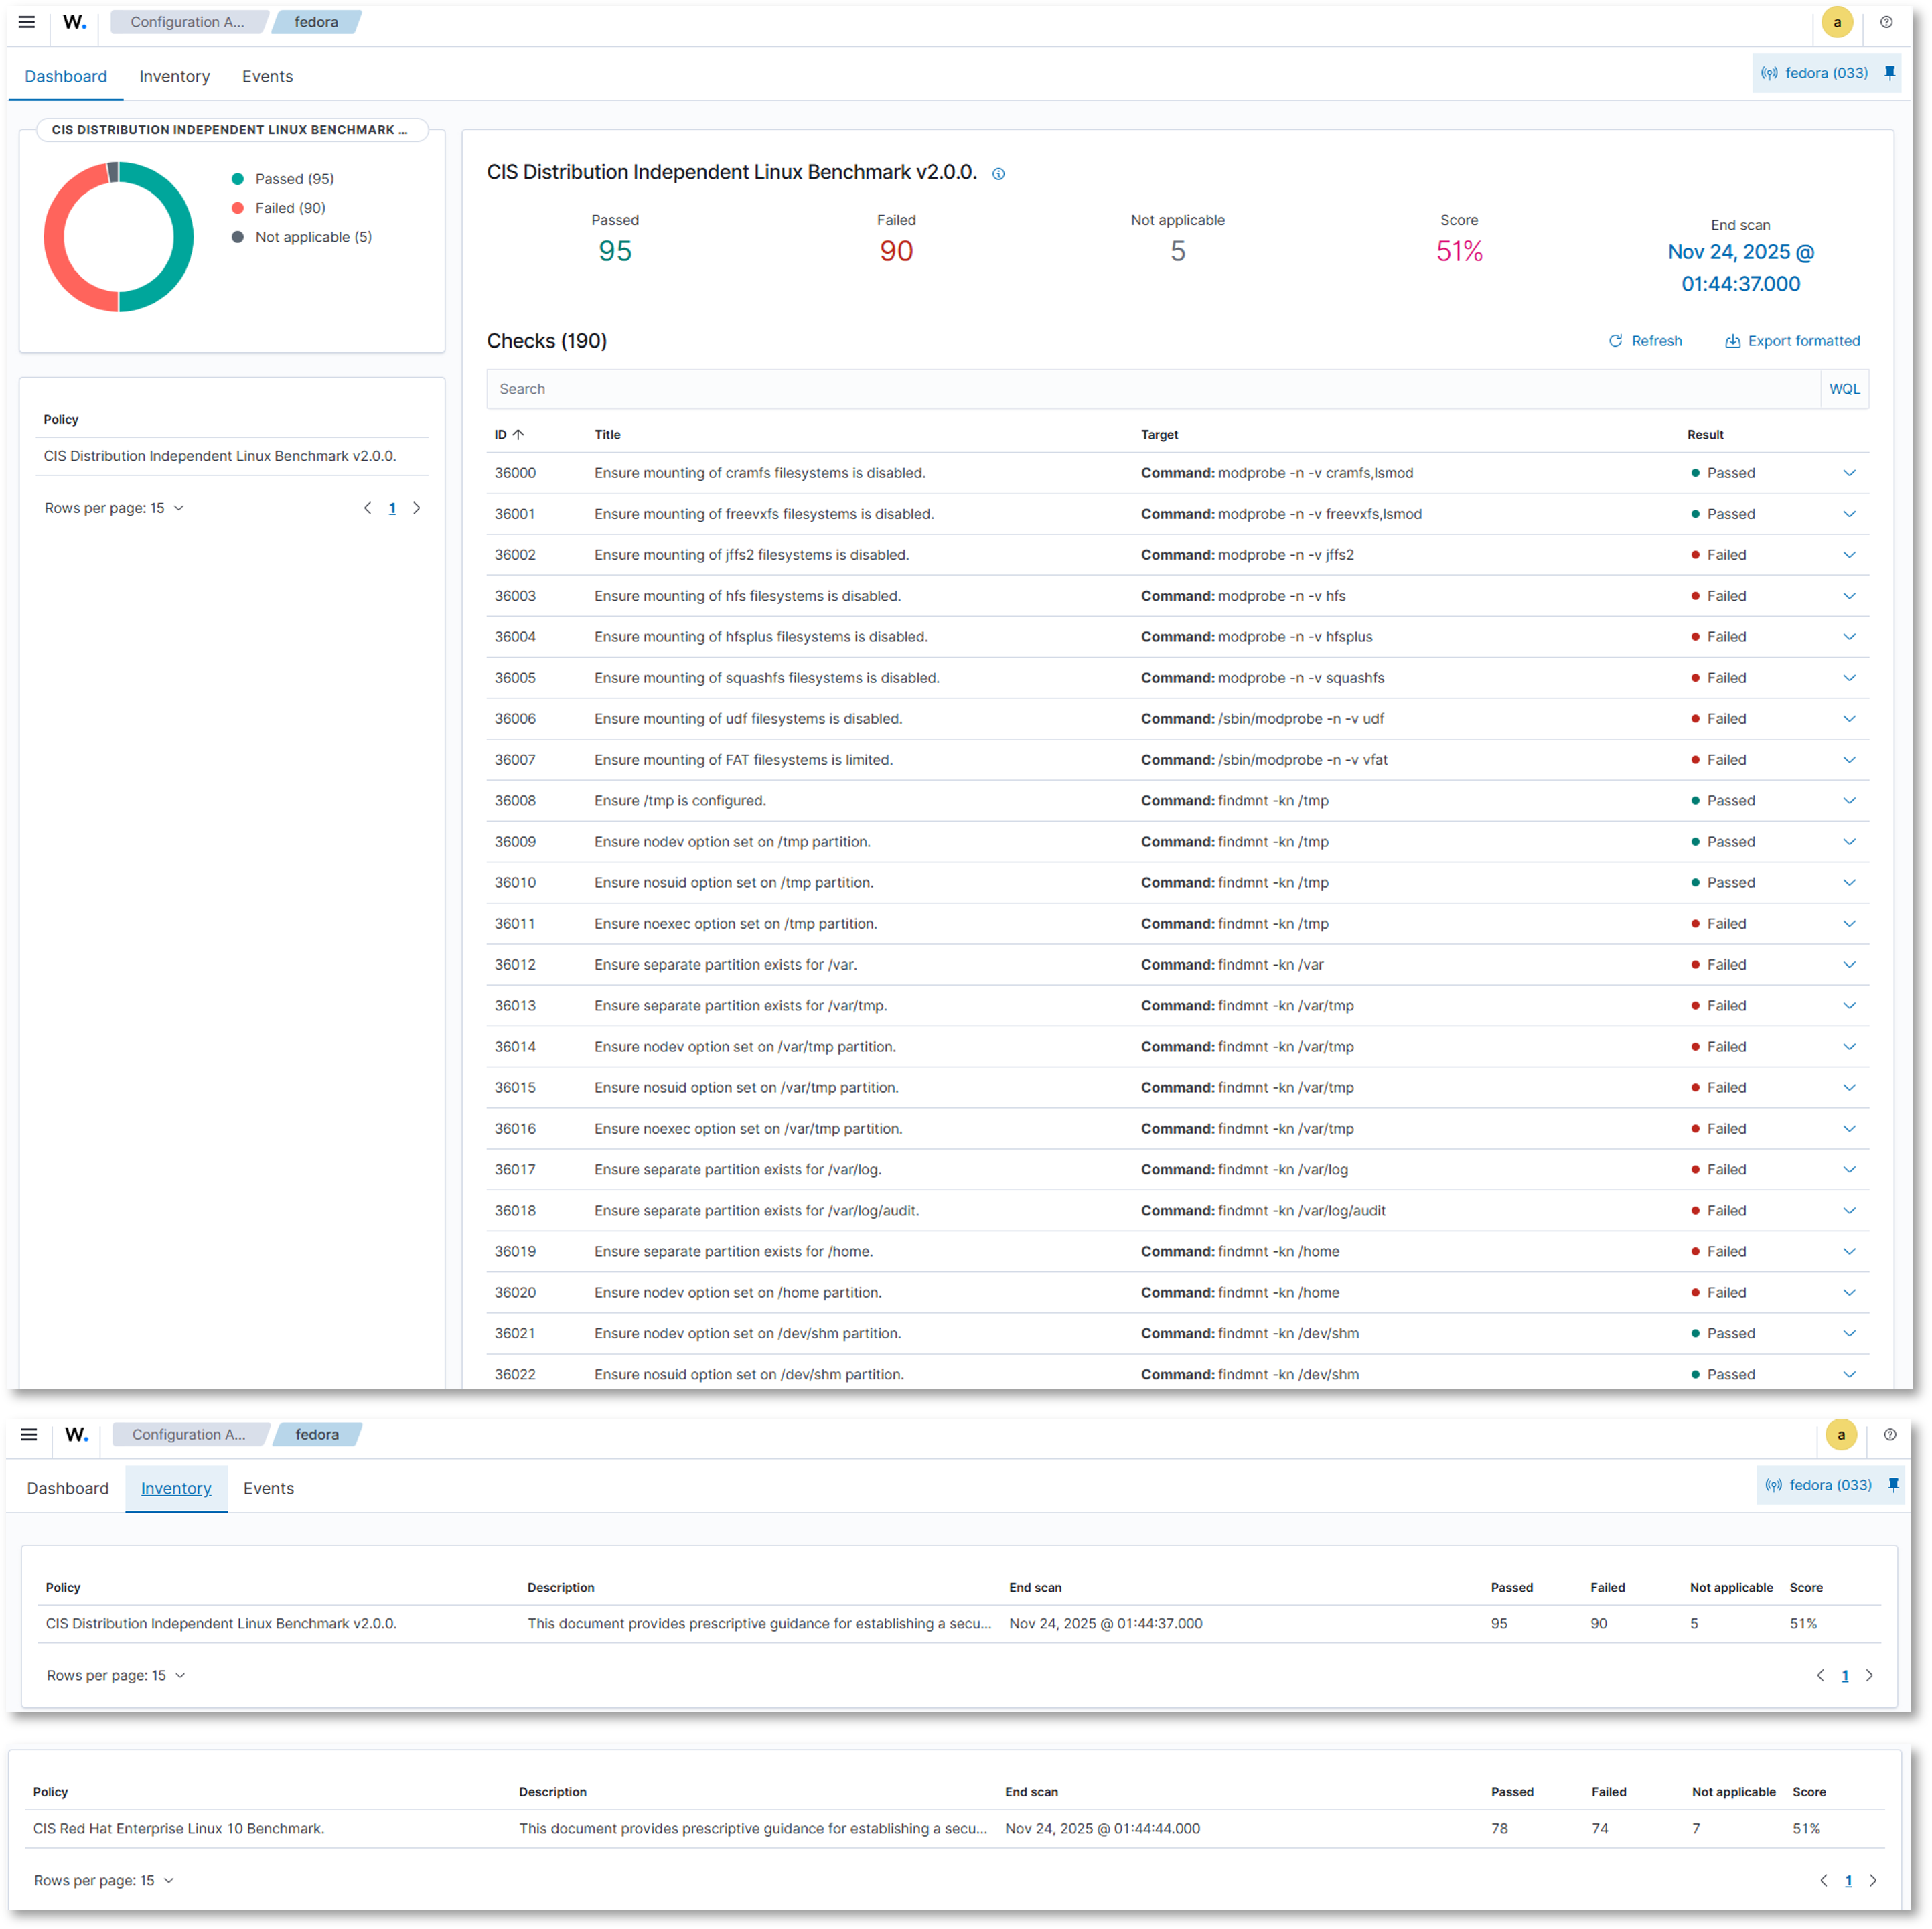
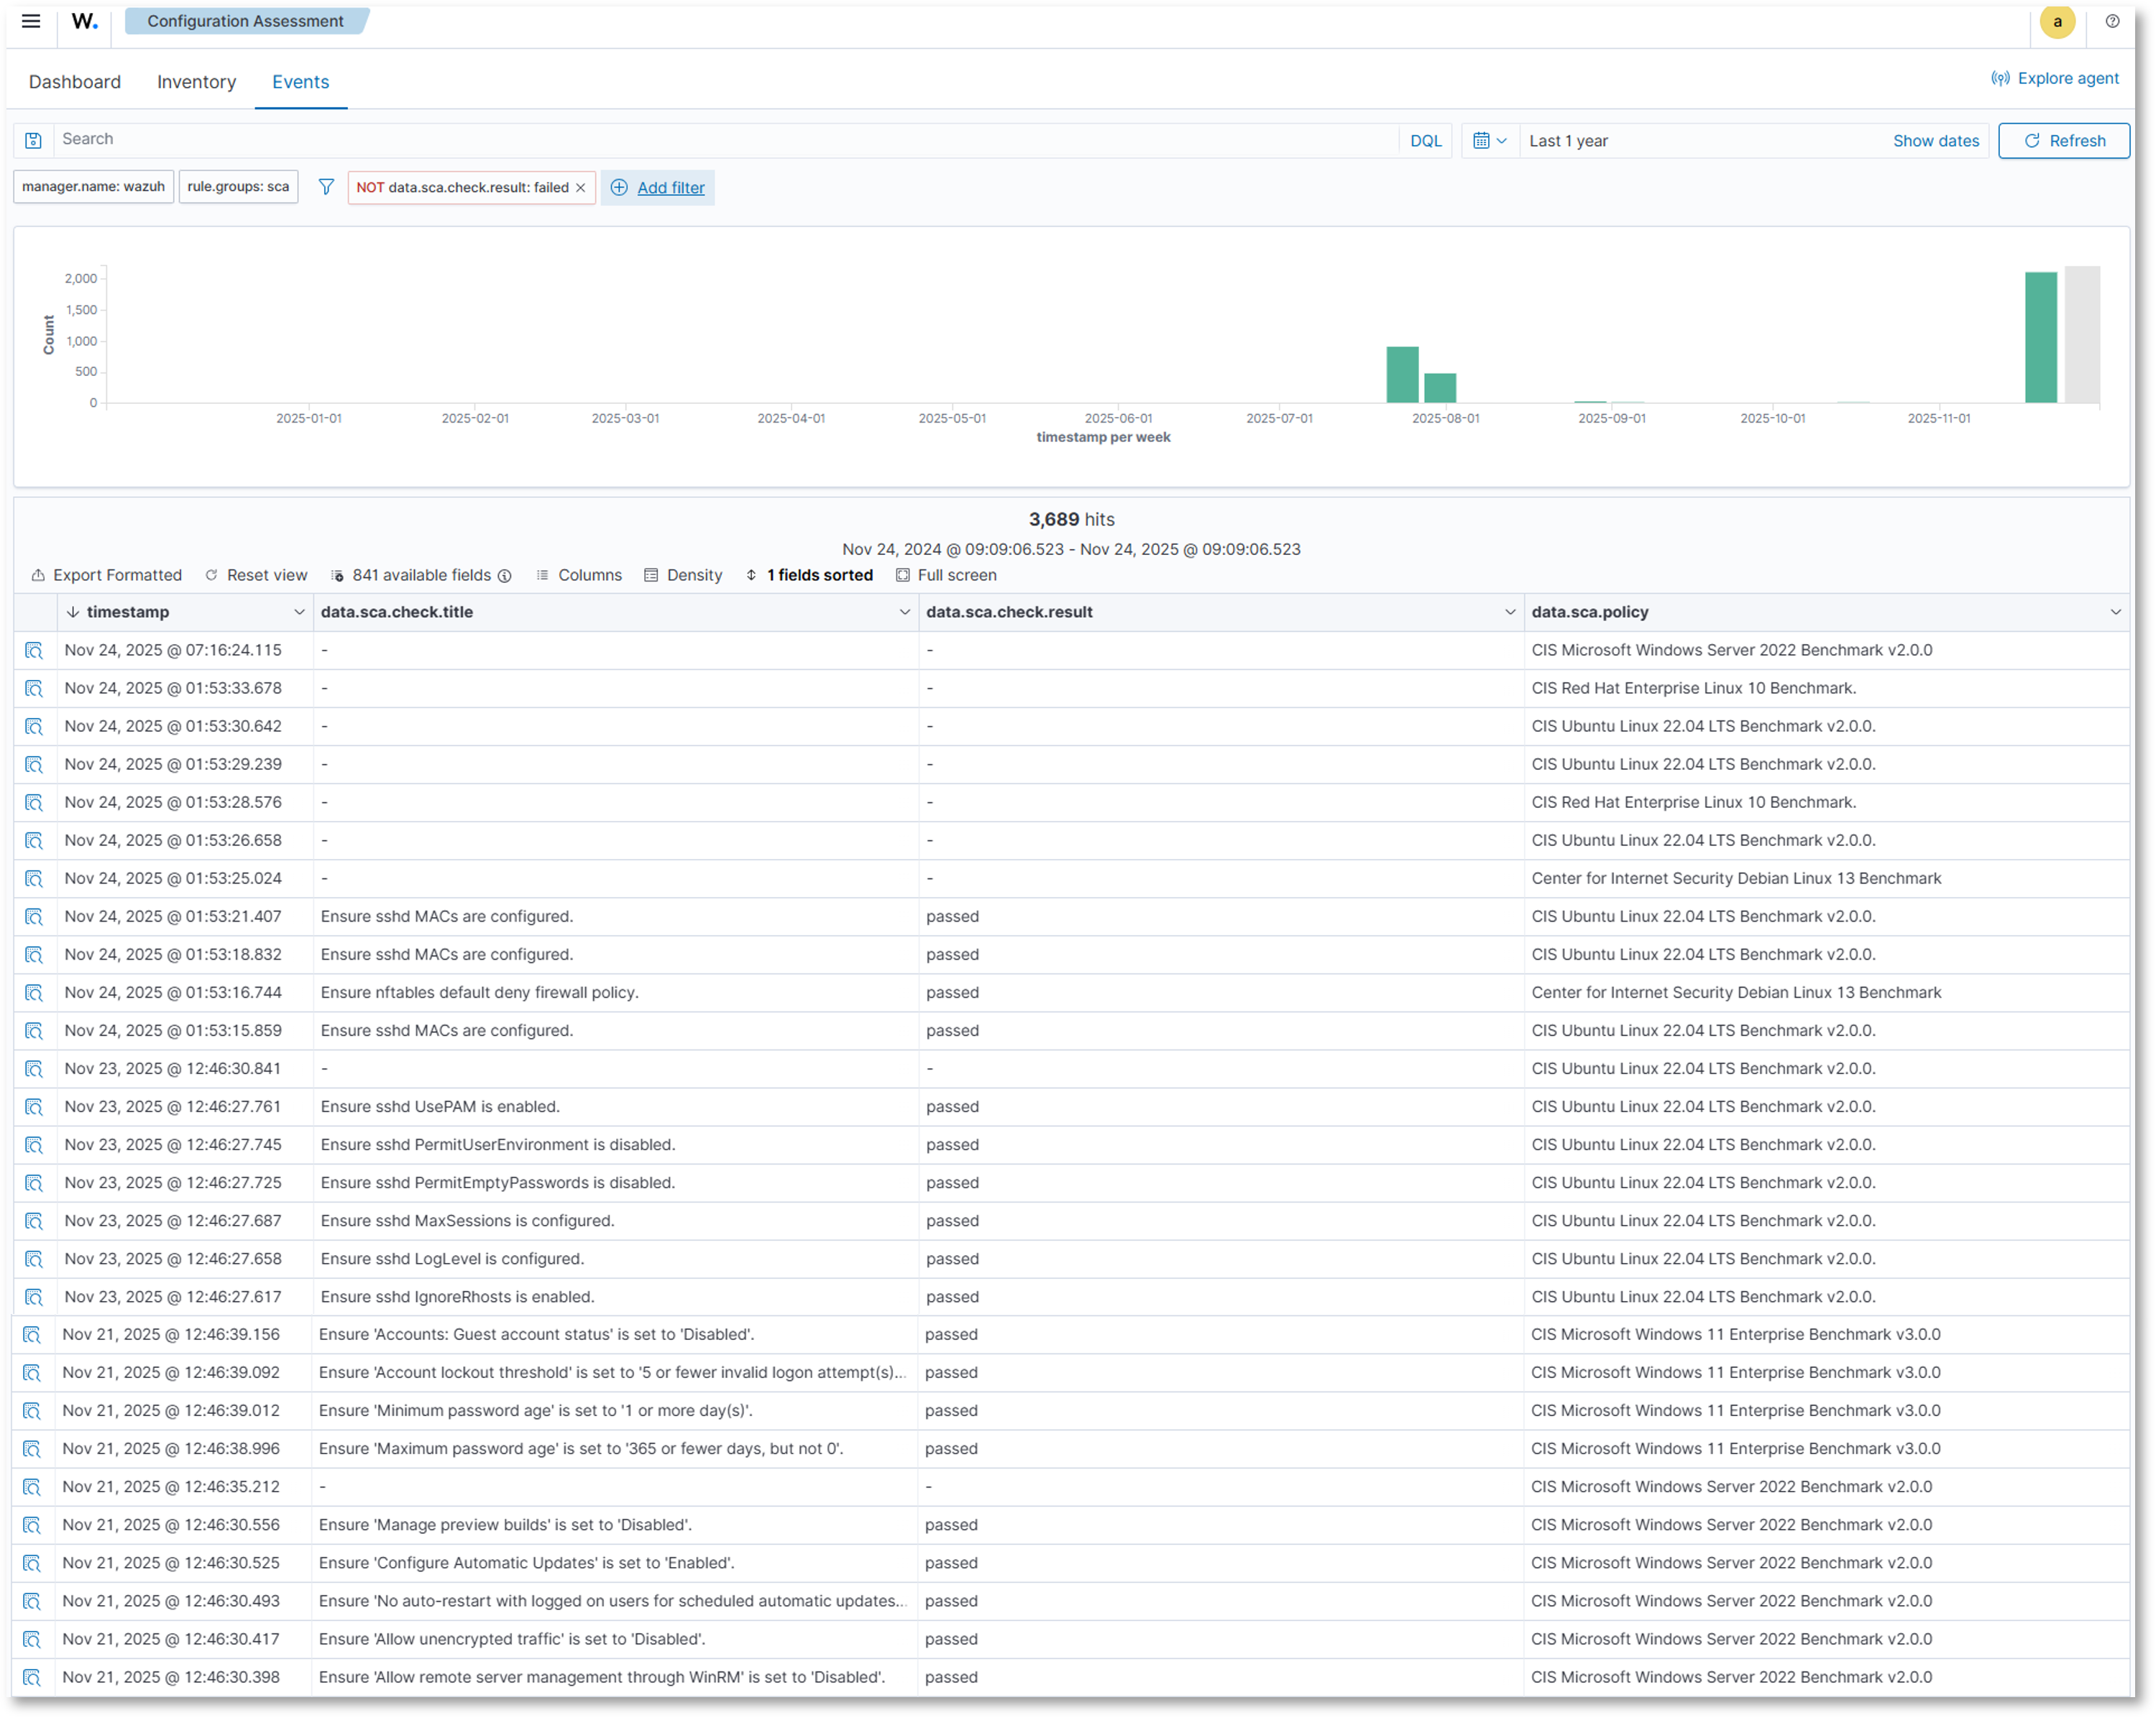
Configuration Management
Visualizations:
Dashboard:
- Per agent SCA showing a summary of passed, failed, and N/A results and overall score
- Policy information, scan data, and checks
- Inventory information: policy, description, scan data, score
- Events: Event count over time, detailed check and policy information
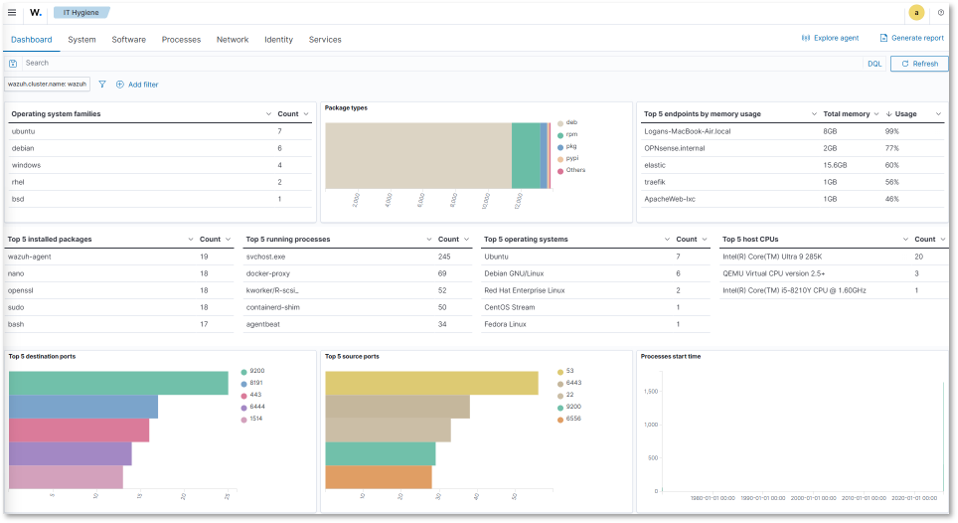
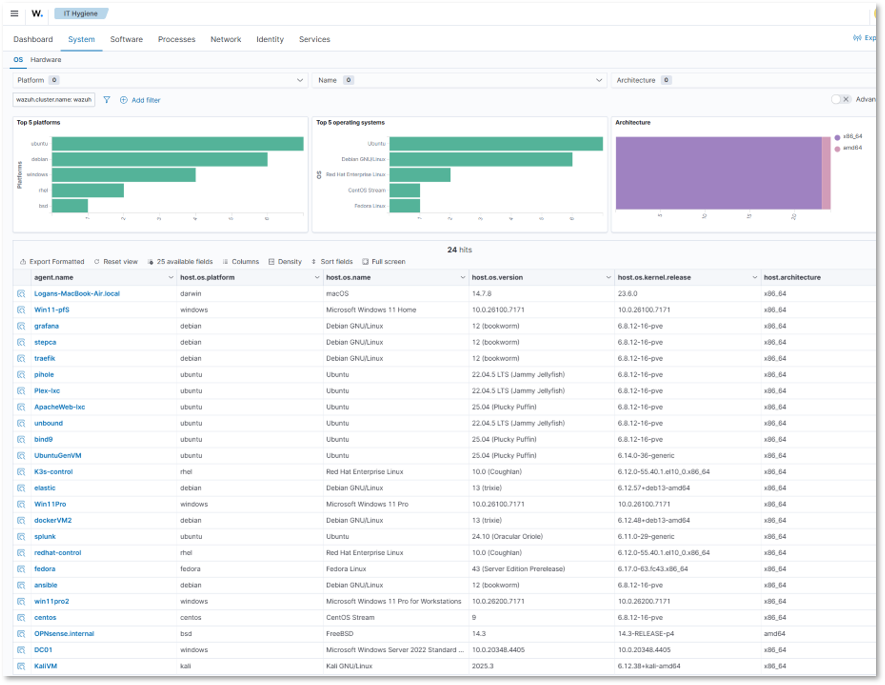
Security Operations / IT Hygiene Dashboard
Visualizations:
Dashboard: Overview of deployed agent hygiene showing OS, installed packages, running processes, hardware, network traffic, and identity information
- System: Platform, OS, and architecture information
- Software: Package, KB, Browser extension, and vendor information
- Processes: Process name, start, PID, PPID, and command line information
- Network: IP address, interface, protocol, listener, and traffic information
- Identity: User and group, shell, and home directory information
- Services: Running service information
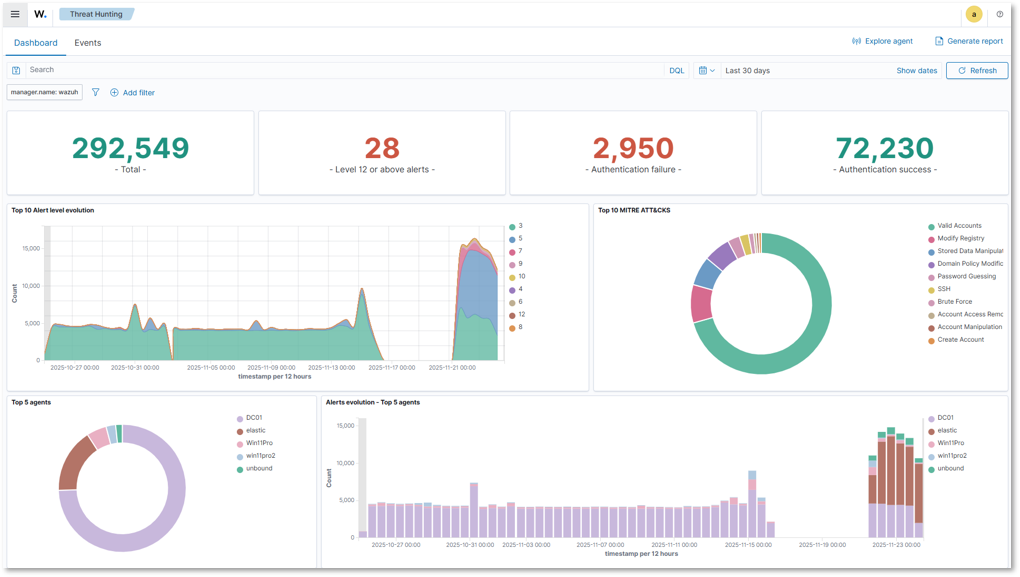
Threat Intelligence
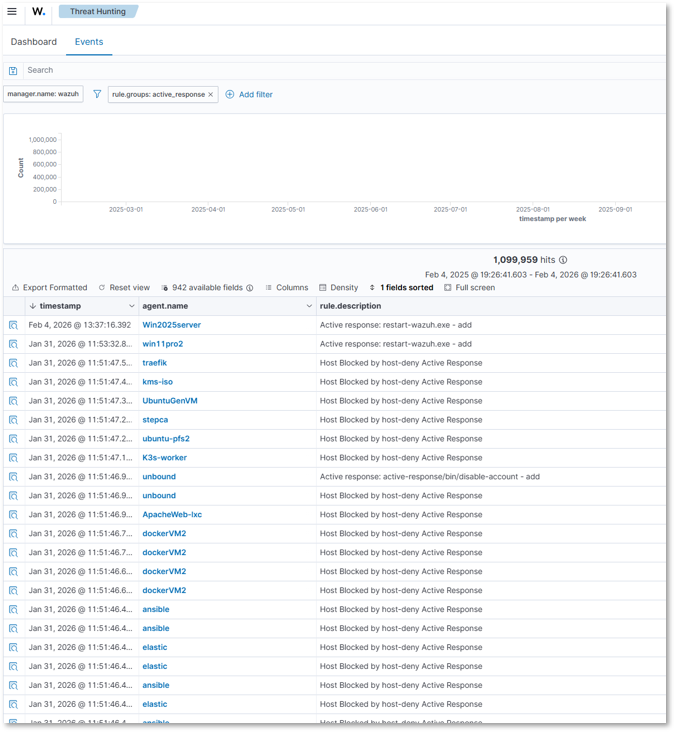
Threat Hunting:
- Total threats detected, alert level, authentication failures/successes, attacks by MITRE tactic/technique, alerts by agent
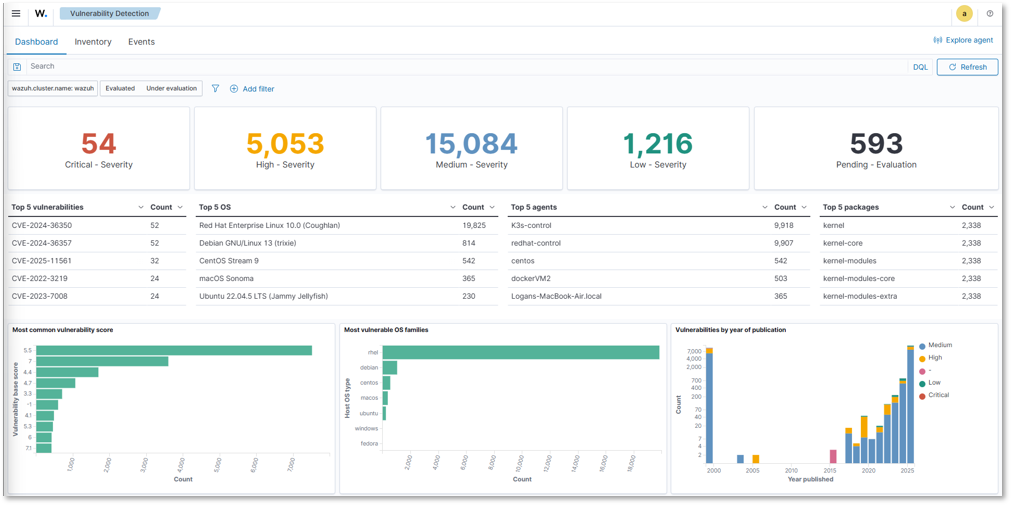
Vulnerability Detection:
- Severity level counts, top 5 CVEs, vulnerabilities by OS, agent, package, and year
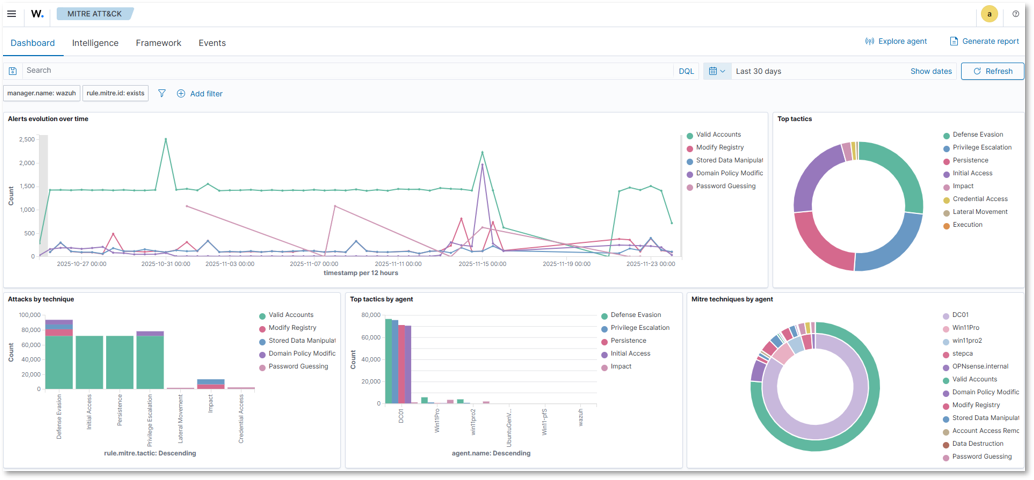
MITRE ATT&CK:
- Alert evolution over time, top tactics, attacks by technique, tactics and techniques by agent
Threat Hunting Queries
Suspicious PowerShell Execution:
rule.groups: windows AND data.win.eventdata.image: *powershell.exe
AND (data.win.eventdata.commandLine: *-encodedcommand*
OR data.win.eventdata.commandLine: *bypass*)
Lateral Movement Detection:
rule.id: 60204 AND rule.description: "Windows: User logon with explicit credentials"
| stats count by data.win.eventdata.subjectUserName, agent.name
Privilege Escalation Attempts:
rule.groups: authentication_success AND
data.win.eventdata.targetUserName: Administrator
| where data.win.eventdata.subjectUserName != Administrator
5. Security Homelab Section Links
- Executive Summary and Security Posture
- Infrastructure Platform, Virtualization Stack and Hardware
- Network Security, Privacy and Remote Access
- Identity, Access, Secrets and Trust Management
- Automation and IaC
- Applications and Services
- Observability and Response, Part 1
- Observability and Response, Part 2
- Cloud IaaS Integration – AWS, Azure and GCP