Observability and Response Architecture, Part 2
Document Control:
Version: 1.1
Last Updated: March 05, 2026
Owner: Paul Leone
Security Orchestration, Automation and Response (SOAR) Platform
Deployment Overview
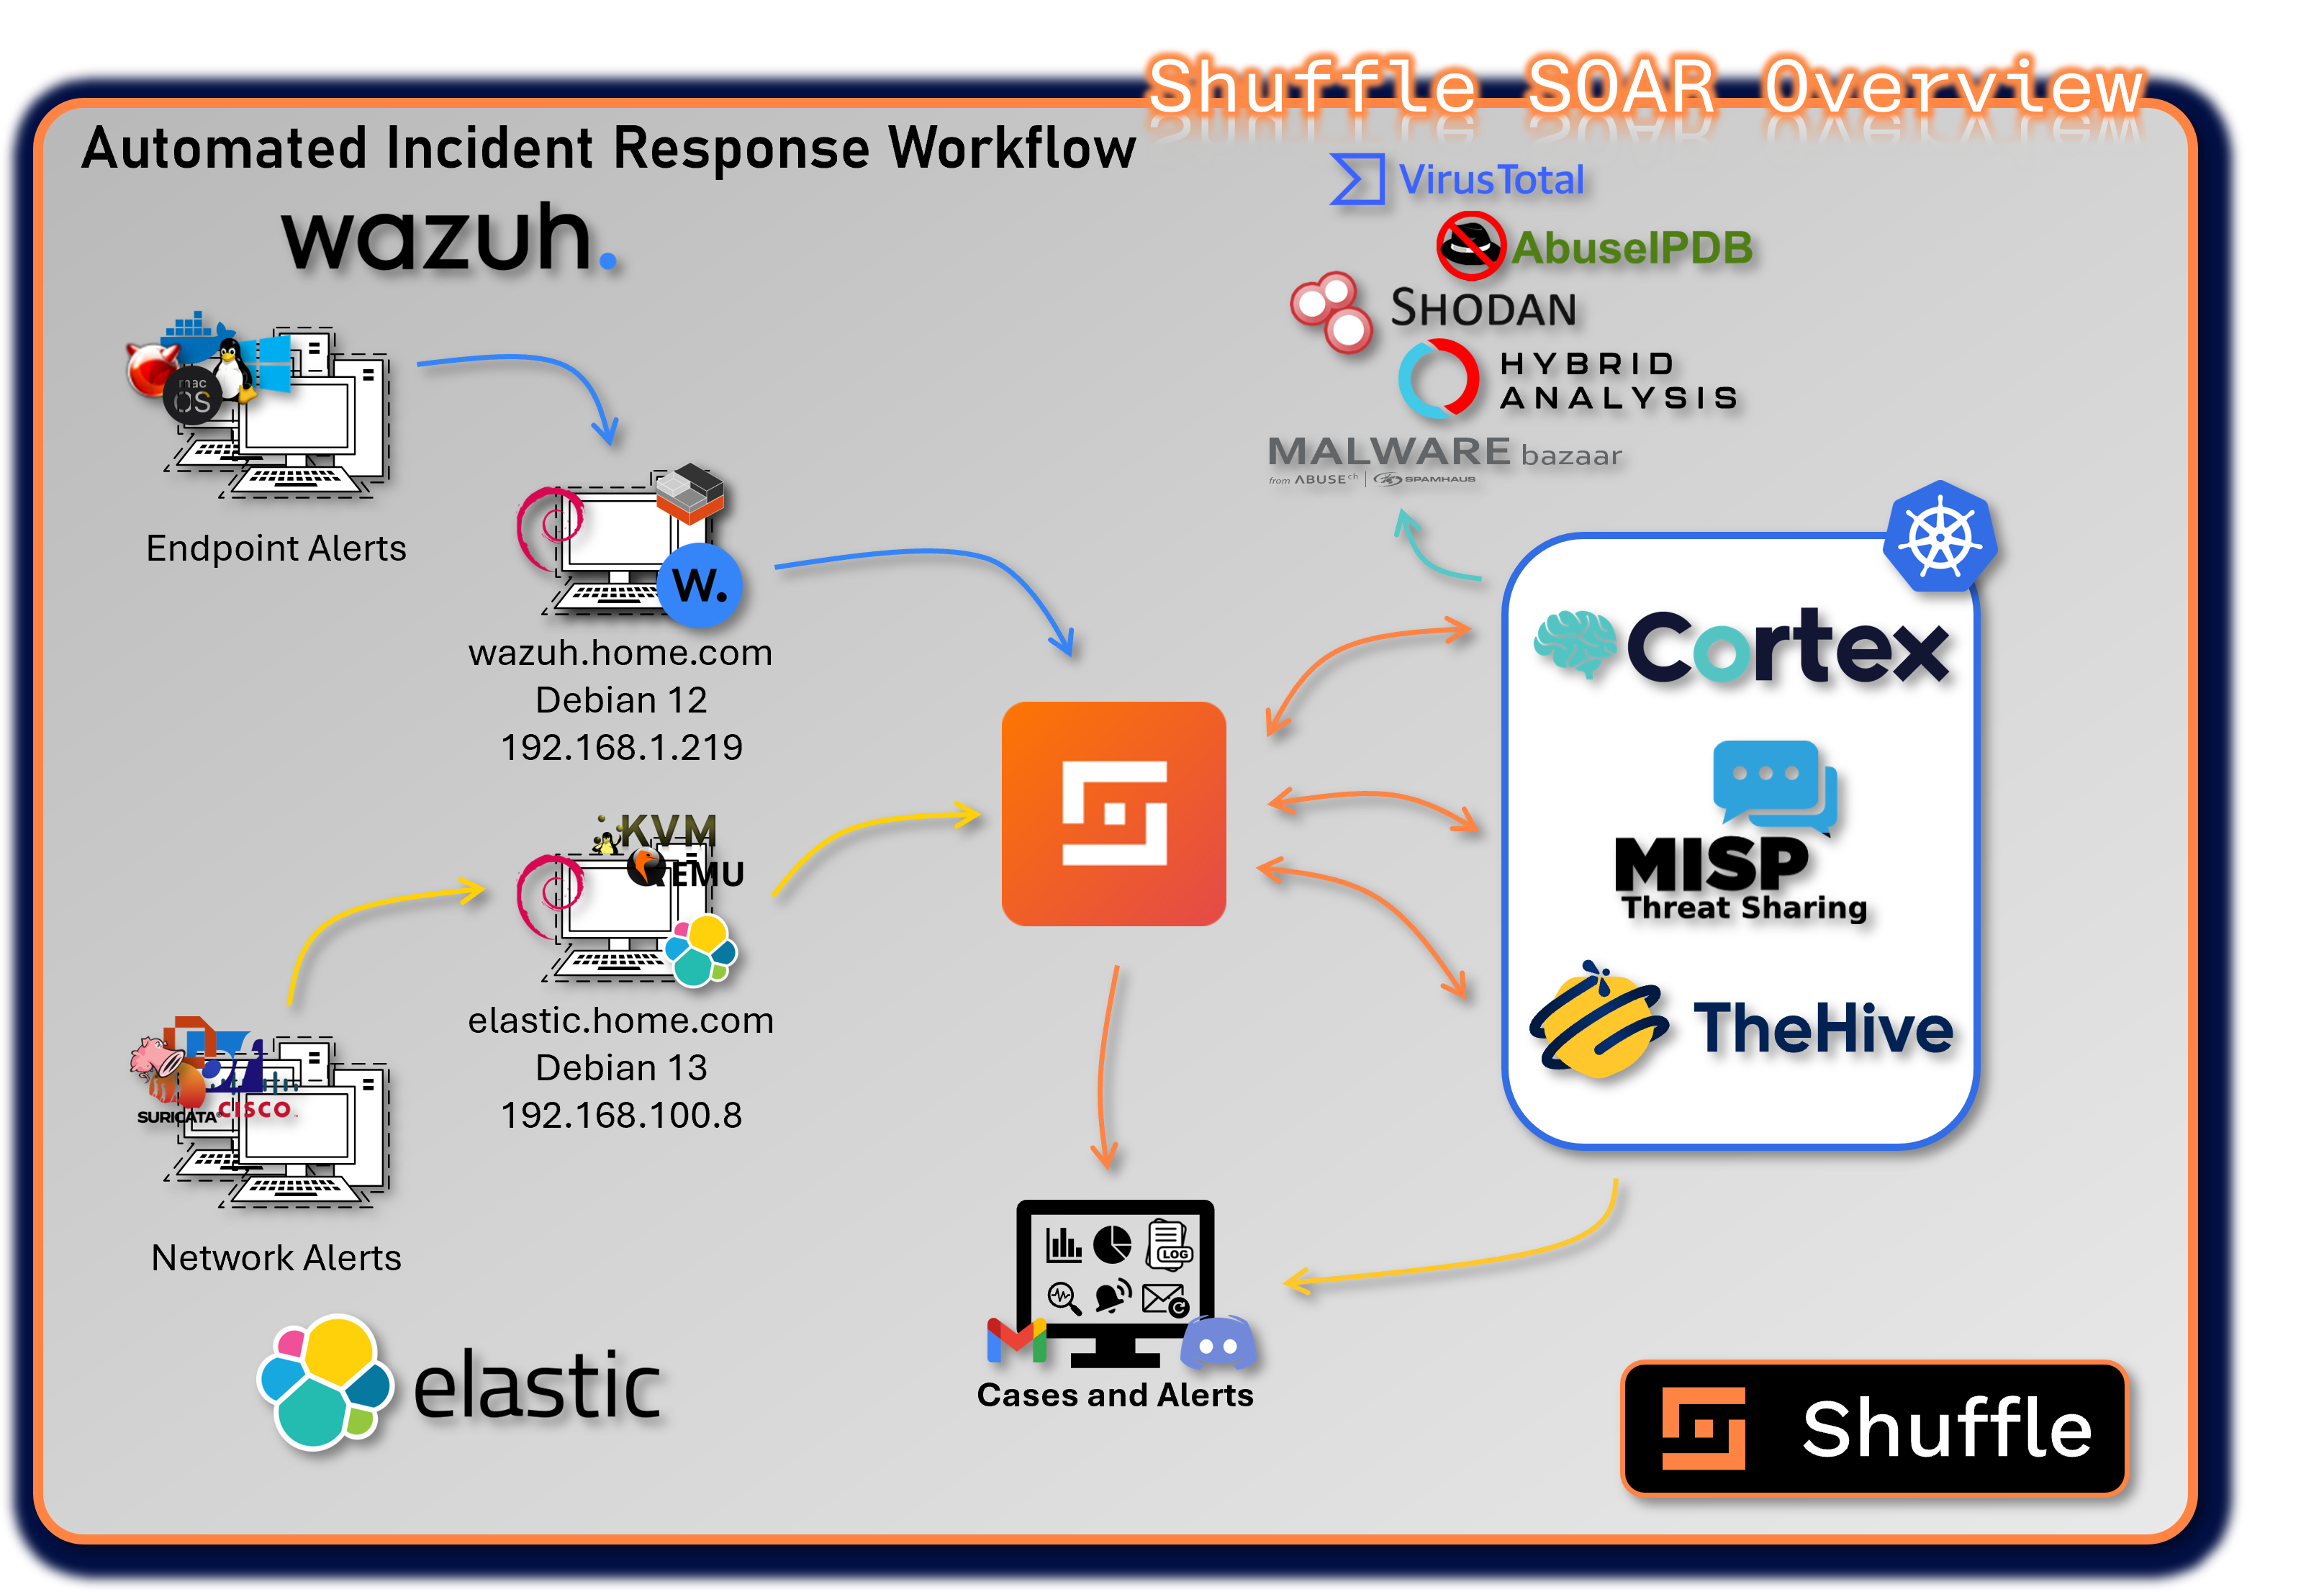
The SOAR platform unifies case management, automated enrichment, threat intelligence sharing, and workflow automation across the entire security stack. It integrates SIEM alerts, EDR telemetry, threat intelligence feeds, and infrastructure controls into a coordinated response ecosystem.
The platform consists of four primary applications: Shuffle, TheHive, Cortex, and MISP. Each fulfills a specialized role within the incident response lifecycle. Together, they deliver automated triage, enrichment, containment, and intelligence distribution, enabling rapid, repeatable, and scalable security operations.
Security Impact
The SOAR ecosystem dramatically reduces response time by automating repetitive tasks, enriching alerts with contextual intelligence, and orchestrating multi-tool actions. Automated workflows ensure consistent triage, reduce human error, and provide structured case management. Integrated threat intelligence enhances detection accuracy, while automated containment actions limit adversary dwell time.
Deployment Rationale
Modern SOC operations require more than detection—they require coordinated, automated response. This SOAR architecture mirrors enterprise-grade security operations by combining case management, enrichment engines, threat intelligence platforms, and automation pipelines. It demonstrates proficiency with incident response frameworks, multi-tool orchestration, and automated decision-making.
Architecture Principles Alignment
Defense in Depth:
- Multiple enrichment engines validate IOCs across independent sources
- Automated containment actions complement SIEM/EDR detections
- Case management, enrichment, and threat intelligence form overlapping response layers
Secure by Design:
- Structured workflows enforce consistent triage and investigation procedures
- API-based integrations use authenticated, encrypted communication
- Automated playbooks reduce manual error and enforce policy compliance
Zero Trust:
- No alert or IOC is implicitly trusted; all are enriched and validated
- Automated workflows enforce least-privilege actions and controlled response steps
- Continuous verification of threat intelligence before actioning
Shuffle - Security Automation Engine
Deployment Overview
Shuffle is the low-code/no-code automation engine that orchestrates workflows across all SOC tools, SIEM platforms, and security infrastructure. It serves as the automation backbone of the SOAR ecosystem, enabling rapid integration, event-driven workflows, and multi-tool response actions.
Shuffle processes alerts from Wazuh, Splunk, Elastic, and other sources, automatically enriching them with intelligence from Cortex, VirusTotal, Shodan, and MISP before triggering case creation or containment actions.
Security Impact
- Automates triage, enrichment, and response actions to reduce MTTR
- Executes containment workflows (firewall blocks, host isolation, account disablement)
- Ensures consistent, repeatable response actions across all alerts
- Provides real-time notifications and workflow execution logs
Deployment Rationale
Shuffle demonstrates the ability to build enterprise-grade automation pipelines without requiring custom code. It integrates seamlessly with SIEM, EDR, threat intelligence, and case management systems, enabling end-to-end automated response.
Architecture Principles Alignment
Defense in Depth: Automates multi-layer response actions across EDR, firewalls, SIEM, and threat intelligence
Secure by Design: API-key isolation, encrypted communication, and controlled workflow execution
Zero Trust: Every alert is enriched and validated before action; no implicit trust in raw telemetry
Deployment Architecture
Shuffle is deployed as a multi-container microservices architecture with the following components:
| Component | Image | IP Address | Purpose |
|---|---|---|---|
| shuffle-frontend | shuffle-frontend:latest | 192.168.200.41 (LB) | React-based web UI for workflow design, execution monitoring, and administration. Provides drag-and-drop workflow builder with 300+ pre-built app integrations. |
| shuffle-backend | shuffle-backend:latest | 10.43.xxx.xxx (ClusterIP) | Go-based backend API handling workflow execution orchestration, app management, webhook processing, and user authentication. Coordinates communication between frontend and execution workers. |
| shuffle-opensearch | opensearch:3.2.0 | 10.43.xxx.xxx (ClusterIP) | OpenSearch database storing workflow definitions, execution history, app configurations, and audit logs. Provides full-text search capabilities for workflow debugging and audit trails. |
| shuffle-orborus | shuffle-orborus:latest | None (internal) | Worker orchestration daemon responsible for spinning up Docker containers to execute workflow app actions. Manages containerized execution environment ensuring isolation and scalability. Runs on Kubernetes nodes as DaemonSet. |
External Access:
- Web Interface: https://192.168.200.41 (ports 80/443)
- Webhook Receiver: https://192.168.200.41/api/v1/hooks/
- API Endpoint: https://192.168.200.41/api/v1/
Integration Points
Shuffle serves as the central orchestration hub connecting:
- TheHive: Automated case creation, task assignment, observable enrichment, and case closure workflows
- Cortex: Trigger analysis jobs, retrieve results, execute responders based on analysis outcomes
- MISP: Automatic IOC submission, threat intelligence queries, event publishing, and feed synchronization
- Wazuh EDR: Alert triage, automated response actions (file quarantine, process termination), agent management
- Elastic (ELK Stack) Network alert triage via API webhook. pfSense, OPNsense and Suricata logs.
- pfSense Firewall: Automatic blocklist updates, firewall rule creation, VPN configuration changes
- Suricata/Snort IDS: Rule updates, signature deployment, detection tuning based on threat intelligence
- Discord: Real-time notifications, alert distribution, case status updates, workflow execution reports
- Email: Phishing analysis workflows, report distribution, executive summaries, alert forwarding
- VirusTotal/AbuseIPDB: Automated reputation checks, malware analysis, IP/domain enrichment
TheHive - Incident Response and Case Management
Deployment Overview
TheHive provides centralized case management, investigation workflows, and collaborative incident response. It aggregates alerts from SIEM and EDR platforms into structured cases, enabling analysts to track tasks, observables, timelines, and response actions.
TheHive acts as the command center for incident response, coordinating investigations across Cortex, MISP, Wazuh, and Shuffle.
Security Impact
- Centralizes all incidents into structured, auditable cases
- Enables collaborative investigations with task assignments and timelines
- Correlates alerts from Splunk, Wazuh, and other sources into unified cases
- Provides metrics dashboards for MTTD, MTTR, and case volume trends
- Ensures consistent documentation for forensic and compliance requirements
Deployment Rationale
TheHive mirrors enterprise SIRP (Security Incident Response Platform) capabilities, demonstrating proficiency with structured case management, workflow orchestration, and collaborative investigations.
Architecture Principles Alignment
Defense in Depth: Combines SIEM, EDR, and threat intelligence alerts into multi-source cases
Secure by Design: Role-based access, audit logs, and structured workflows
Zero Trust: All observables validated through Cortex/MISP before actioning
Deployment Specifications
- Container Image: strangebee/thehive:5.5.13-1
- Deployment Type: Helm chart (managed deployment)
- Replicas: 1 (single instance)
- External Access: LoadBalancer service at 192.168.200.33
- Port 9000 (HTTP/HTTPS web interface)
- Port 9095 (Kamon metrics for Prometheus integration)
- Persistent Storage: Backed by Cassandra and Elasticsearch for data durability
- Resource Allocation:
- CPU: 2 cores
- Memory: 4GB
- Storage: 20GB (application data via Cassandra)
Key Capabilities
- Case Management: Create, assign, and track security incidents with customizable workflows
- Task Orchestration: Break down investigations into actionable tasks with assignments and deadlines
- Observable Analysis: Submit IOCs (IPs, domains, hashes, URLs) to Cortex for automated analysis
- Alert Correlation: Aggregate alerts from SIEM (Splunk, Wazuh) into unified cases
- Collaboration: Team-based investigations with real-time updates and commenting
- Reporting: Generate executive summaries and technical reports from case data
- Metrics Dashboard: Track MTTD (Mean Time to Detect), MTTR (Mean Time to Respond), case volume trends
Integration Points
- Cortex: Automated observable analysis and enrichment
- MISP: Bi-directional IOC sharing (export confirmed threats, import external intelligence)
- Wazuh: Automated case creation from EDR alerts (via Shuffle workflow)
- Shuffle: Workflow automation for alert triage and notification distribution
- Discord: Real-time notifications for high-severity cases
- SMTP Relay: Gmail notifications
Cortex - Observable Analysis and Active Response Engine
Deployment Overview
Cortex automates the analysis of observables (IOCs) using a wide range of analyzers and responders. It enriches IPs, domains, hashes, URLs, and files with intelligence from VirusTotal, AbuseIPDB, Shodan, OTX, and internal sources.
Cortex responders execute automated containment actions such as firewall rule updates, blocklist modifications, and case escalations.
Security Impact
- Provides automated, multi-engine IOC analysis
- Executes rapid containment actions via responders
- Enhances detection accuracy through cross-source enrichment
- Supports dynamic malware analysis via sandbox integrations
Deployment Rationale
Cortex demonstrates advanced enrichment and automated response capabilities found in enterprise SOCs. Its analyzer/responder model enables modular, scalable intelligence processing and automated containment workflows.
Architecture Principles Alignment
Defense in Depth: Multiple analyzer categories validate IOCs across independent sources
Secure by Design: Controlled responder execution; strict API authentication
Zero Trust: No IOC trusted without multi-engine validation
Deployment Specifications
- Container Image: thehiveproject/cortex:latest
- Deployment Type: Kubernetes Deployment
- Replicas: 1
- External Access: LoadBalancer service at 192.168.200.40
- Port 9001 (HTTP API and web interface)
- Backend Database: Elasticsearch (for job history and results)
- Resource Allocation:
- CPU: 2 cores (scales with analyzer concurrency)
- Memory: 4GB (increases with active jobs)
- Storage: 10GB (job results and cache)
Analyzers Enabled
- VirusTotal
- MISP
- AbuseIPDB
- Malware Bazaar
- Shodan
- Cyberchef
- Hybrid Analysis
Responders Enabled
- VirusTotal Downloader
- Mailer
- Wazuh
- Shuffle
- N8n
MISP - Threat Intelligence Sharing Platform
Deployment Overview
MISP provides structured threat intelligence management, IOC sharing, and collaborative intelligence workflows. It stores, correlates, and distributes threat indicators across the SOAR ecosystem.
MISP integrates with Cortex, TheHive, Shuffle, and external intelligence feeds to enrich alerts and cases with contextual threat data.
Security Impact
- Enhances detection accuracy through curated threat intelligence
- Enables bi-directional sharing of confirmed IOCs
- Correlates related events to identify campaigns and intrusion sets
- Supports automated enrichment and threat scoring
Deployment Rationale
MISP demonstrates proficiency with structured threat intelligence, IOC lifecycle management, and intelligence-driven detection. It mirrors enterprise CTI workflows where intelligence is continuously ingested, validated, enriched, and distributed across SOC tools.
Architecture Principles Alignment
Defense in Depth: Adds intelligence-driven detection to complement SIEM/EDR telemetry
Secure by Design: Signed events, role-based access, and controlled feed synchronization
Zero Trust: All intelligence validated before distribution; no implicit trust in external feeds
Deployment Specifications
MISP is deployed as a multi-container application stack with the following components:
| Component | Image | IP Address | Purpose |
|---|---|---|---|
| misp-core | ghcr.io/misp/misp-docker/misp-core:latest | 192.168.200.37 (LB) | Main MISP application (web UI, API, background workers) |
| misp-db | mariadb:10.11 | 10.43.151.59 (ClusterIP) | MySQL/MariaDB database for MISP data storage |
| misp-redis | valkey/valkey:7.2 | 10.43.131.214 (ClusterIP) | Redis cache for session management and job queuing |
| misp-modules | ghcr.io/misp/misp-docker/misp-modules:latest | 10.43.234.246 (ClusterIP) | Expansion and enrichment modules for automated IOC enrichment |
| misp-guard | ghcr.io/misp/misp-docker/misp-guard:latest | 10.43.97.195 (ClusterIP) | Security proxy protecting MISP core from malicious input |
External Access:
- Web Interface: https://192.168.200.37 (ports 80/443)
Integration Points
- TheHive: Bi-directional IOC exchange (TheHive cases → MISP events, MISP feeds → TheHive alerts)
- Cortex: MISP lookup analyzer queries threat intelligence database
- Wazuh: EDR threat intelligence module queries MISP for known malicious indicators
Supporting Infrastructure
Cassandra - Distributed NoSQL Database
Purpose: Scalable, fault-tolerant data store for TheHive case data, observables, and audit logs.
Deployment Specifications:
- Container Image: cassandra:4.1.7
- Deployment Type: StatefulSet (ensures stable network identity and persistent storage)
- Replicas: 1 (production would use 3+ node cluster for high availability)
- External Access: LoadBalancer service at 192.168.200.36
- Port 9042 (CQL native protocol)
- Persistent Volume: 100GB SSD-backed storage
- Replication Strategy: SimpleStrategy with replication_factor=1 (single node)
Configuration Highlights:
- Keyspace: TheHive data stored in dedicated keyspace with TTL policies for data retention
- Consistency Level: LOCAL_ONE (single node) / LOCAL_QUORUM (production multi-node)
- Backup Strategy: Daily snapshots via cron job, retained for 14 days
- Monitoring: Exposed JMX metrics for Prometheus scraping
Elasticsearch - Search and Analytics Engine
Purpose: Full-text search, log aggregation, and analytics for TheHive cases, Cortex job results, and observables.
Deployment Specifications:
- Container Image: docker.elastic.co/elasticsearch/elasticsearch:9.2.2
- Deployment Type: StatefulSet (single-node cluster)
- Replicas: 1
- External Access: LoadBalancer service at 192.168.200.34
- Port 9200 (HTTP REST API)
- Persistent Volume: 200GB SSD-backed storage
- Cluster Name: soc-elasticsearch
- Node Roles: master, data, ingest (combined role in single-node deployment)
Index Management:
- TheHive Indices: Cases, tasks, observables, audit logs with 90-day retention
- Cortex Indices: Analysis jobs, results, analyzer reports with 30-day retention
- Index Lifecycle Management (ILM): Automated rollover and deletion based on age/size
- Snapshots: Daily backups to NAS via snapshot repository
Performance Tuning:
- Heap Size: 4GB (50% of allocated memory)
- Shards: 1 primary shard per index (low-volume lab environment)
- Replicas: 0 (single node, no replication)
- Refresh Interval: 5 seconds (balance between real-time search and indexing performance)
OpenSearch - Shuffle Workflow Database
Purpose: Storage and retrieval of Shuffle workflow definitions, execution history, app configurations, and audit logs.
Deployment Specifications:
- Container Image: opensearch:3.2.0
- Deployment Type: StatefulSet (single-node cluster)
- Replicas: 1
- External Access: ClusterIP only (internal communication with Shuffle backend)
- Port 9200 (HTTP REST API)
- Persistent Volume: 100GB SSD-backed storage
- Cluster Name: shuffle-opensearch
Data Storage:
- Workflow Definitions: JSON representations of workflow configurations and app settings
- Execution History: Complete audit trail of all workflow runs with timestamps, inputs, outputs, and errors
- App Cache: Downloaded app containers and OpenAPI specifications for rapid workflow execution
- User Activity Logs: Authentication events, workflow modifications, permission changes
Performance Characteristics:
- Query Performance: Sub-second search for workflow debugging and historical analysis
- Retention: 90-day execution history (configurable based on storage capacity)
- Backup Strategy: Daily snapshots to NAS; integrated with Kubernetes backup automation
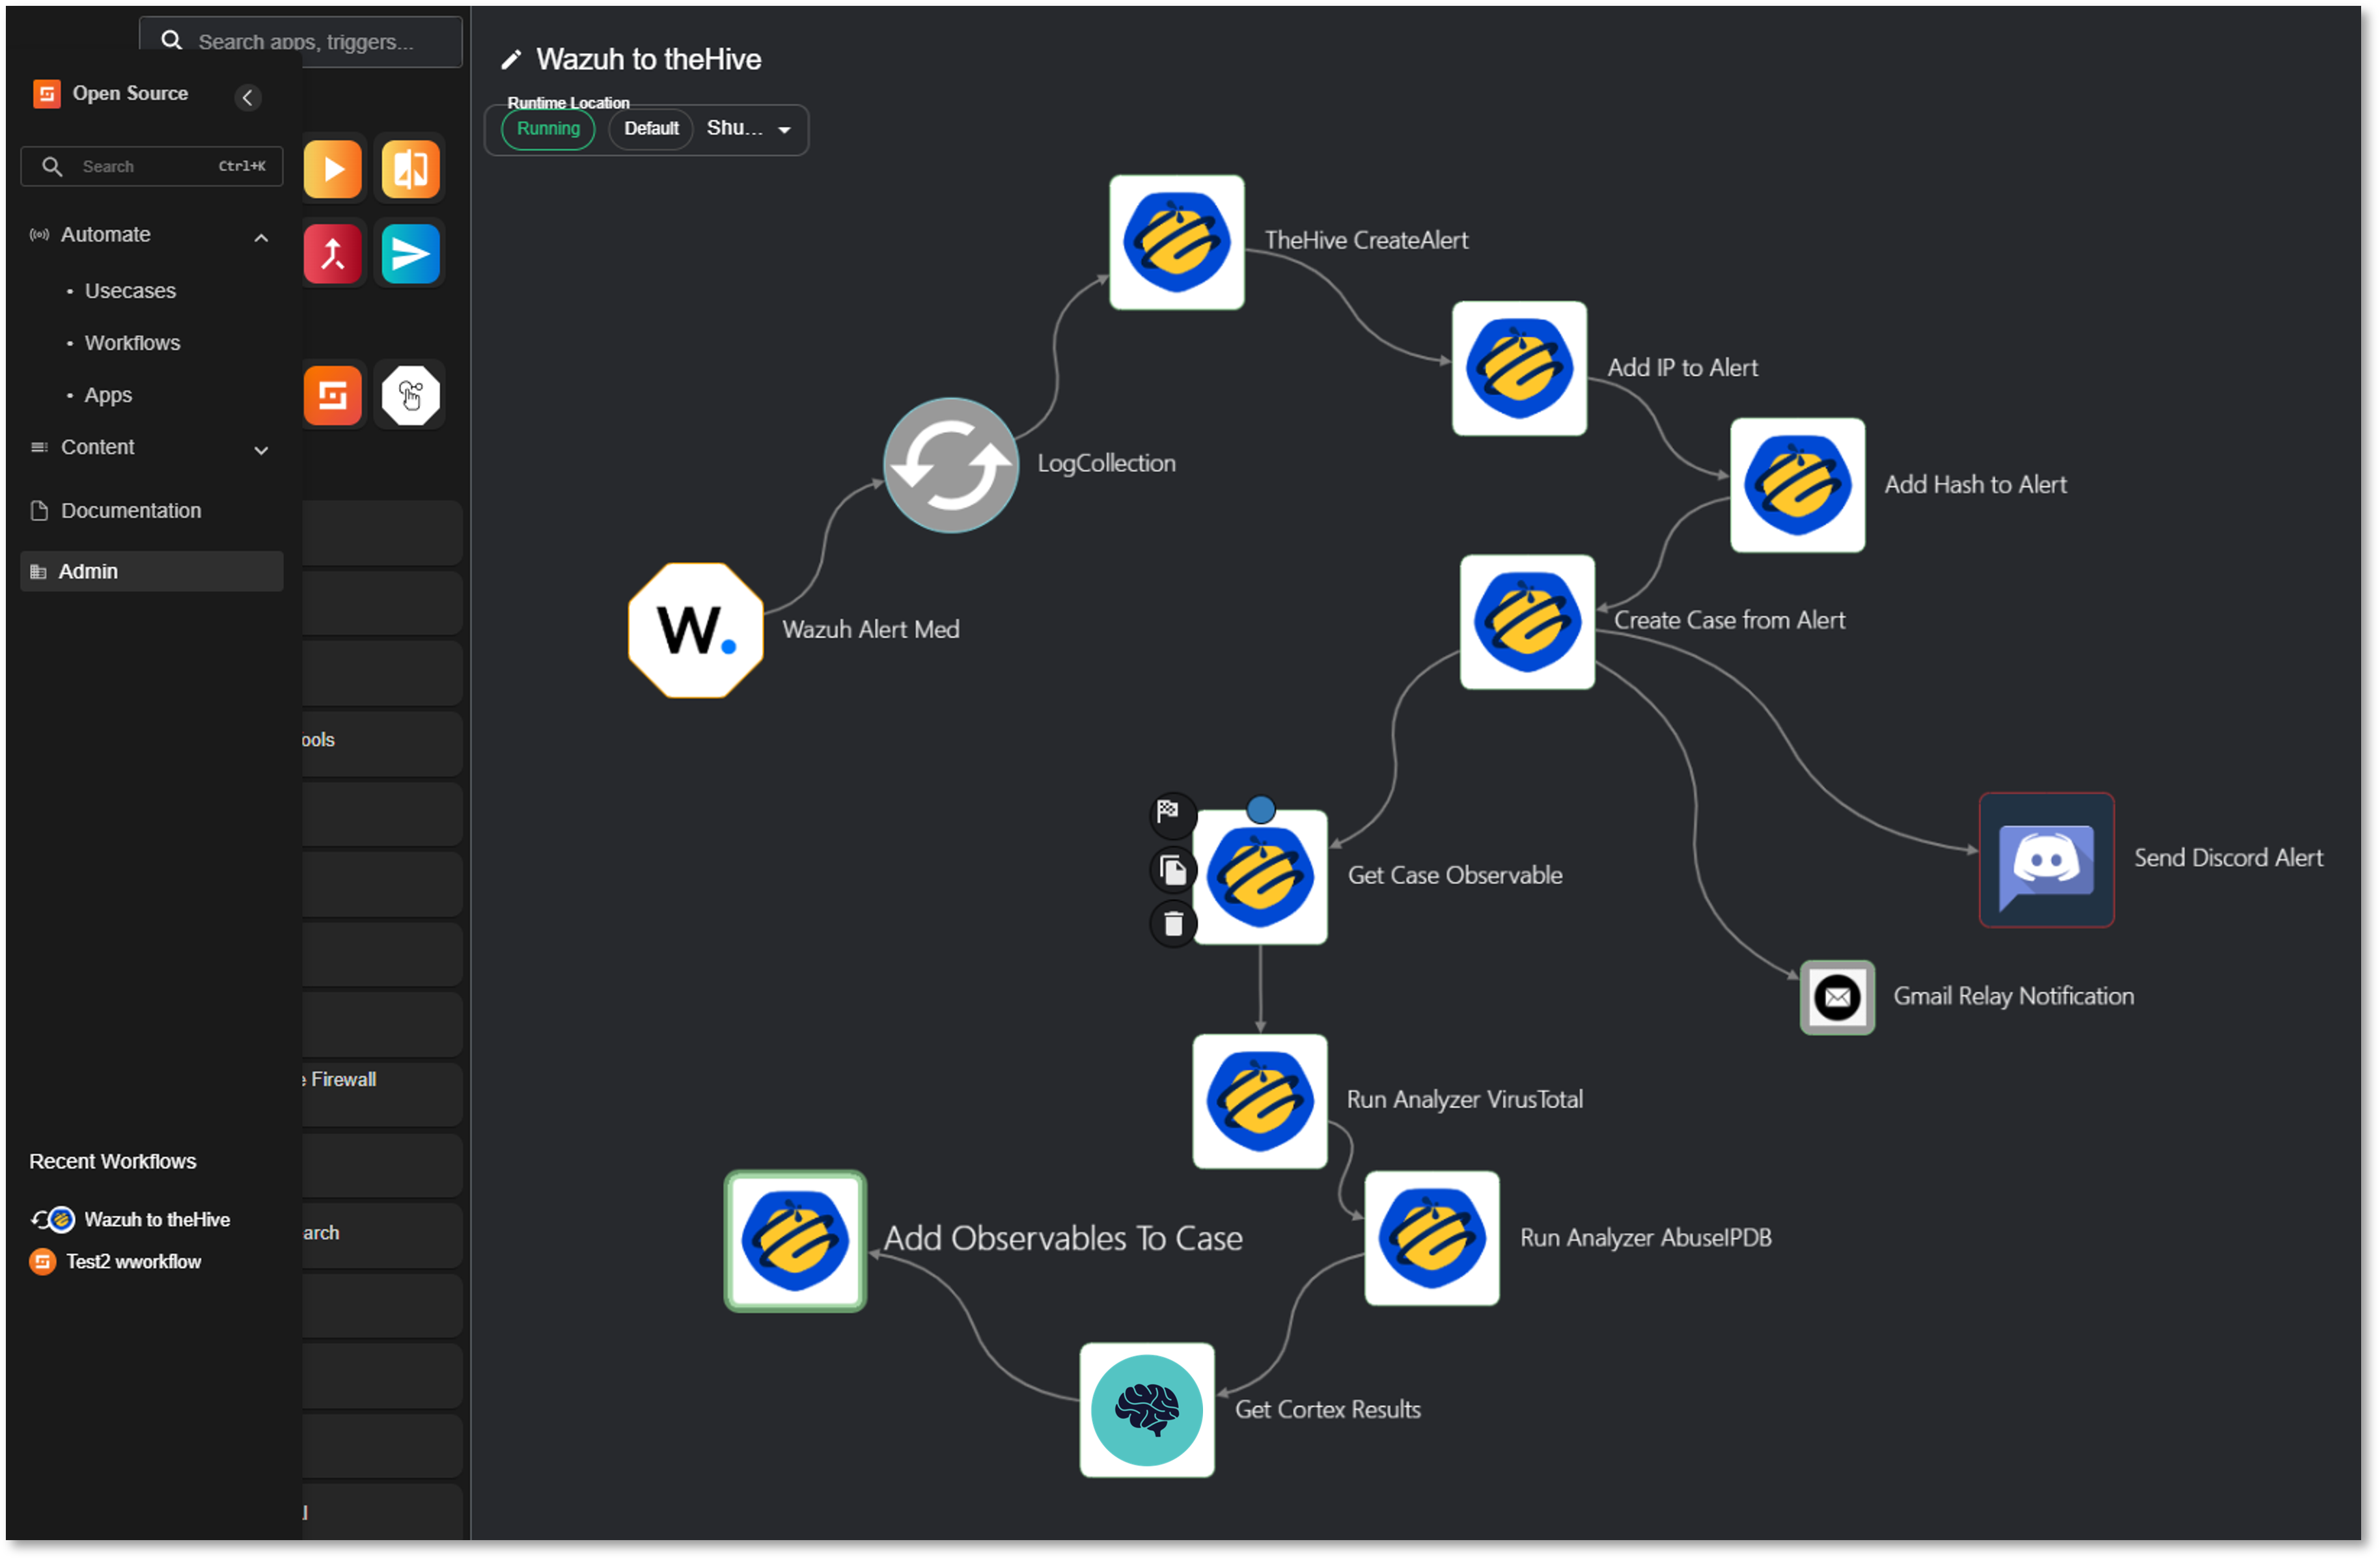
SOAR Workflow: Automated Endpoint Threat Intelligence Pipeline
Overview
SOAR workflow that automates Wazuh alert triage through TheHive case management, Cortex-based IOC enrichment, and multi-channel notifications.
Trigger: Wazuh webhook (Severity ≥ 7)
Tools: Wazuh EDR, TheHive, Cortex, VirusTotal, AbuseIPDB, Discord, Gmail
Workflow Execution
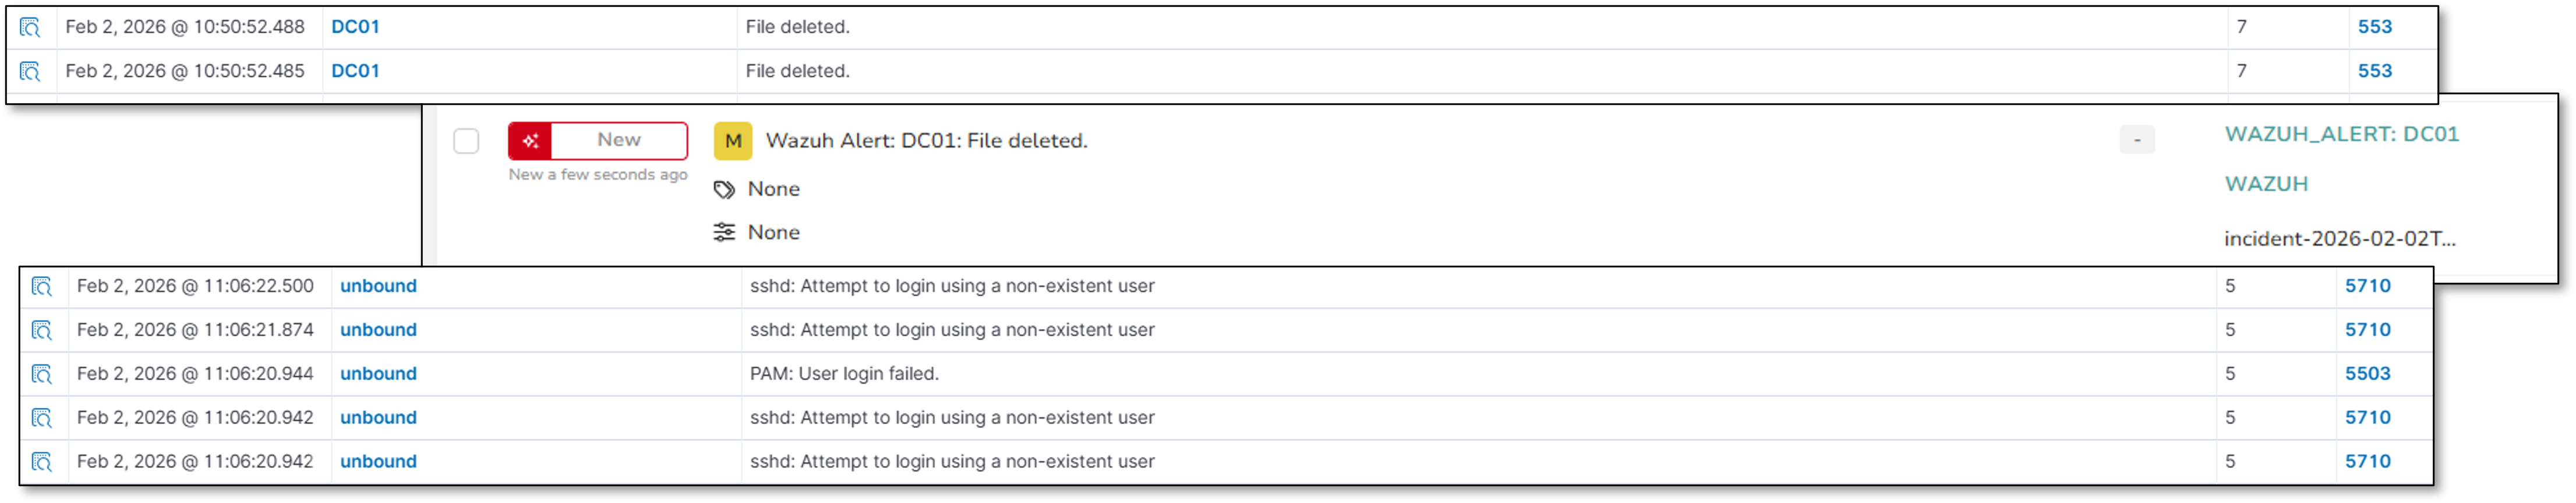
1. Alert Ingestion
- Wazuh Alert Med (Trigger): Receives security event via webhook
- LogCollection (Parser): Extracts structured alert data
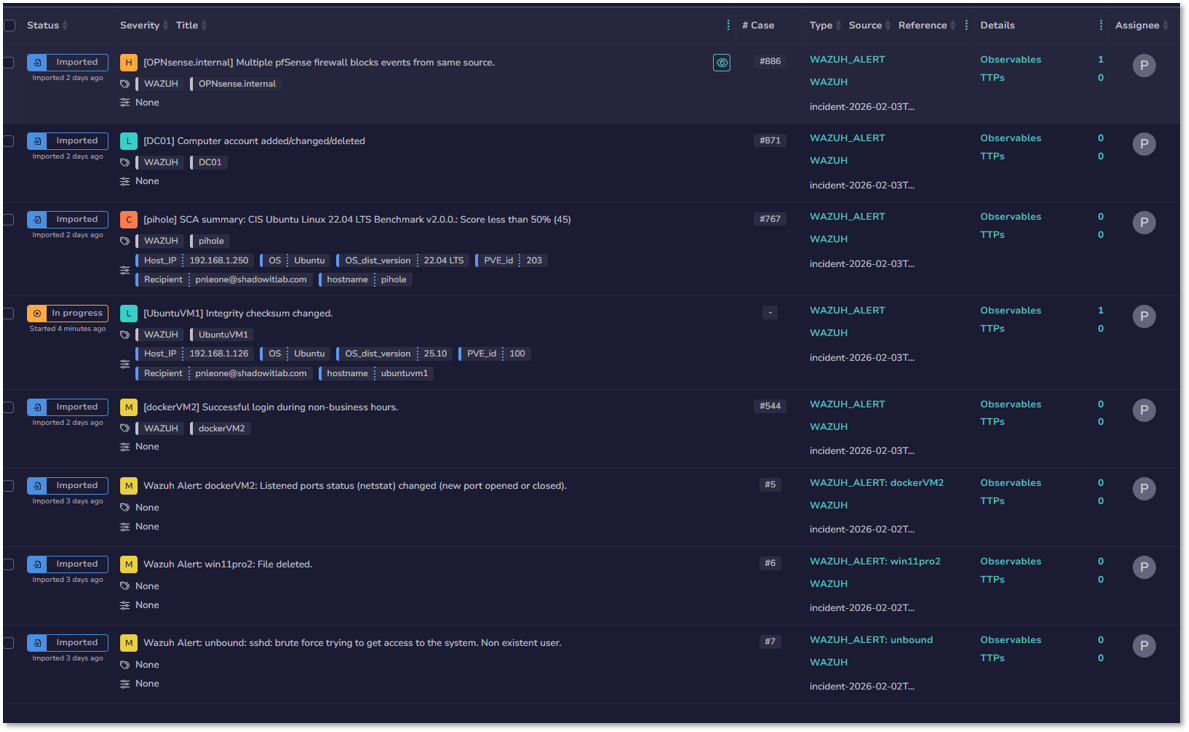
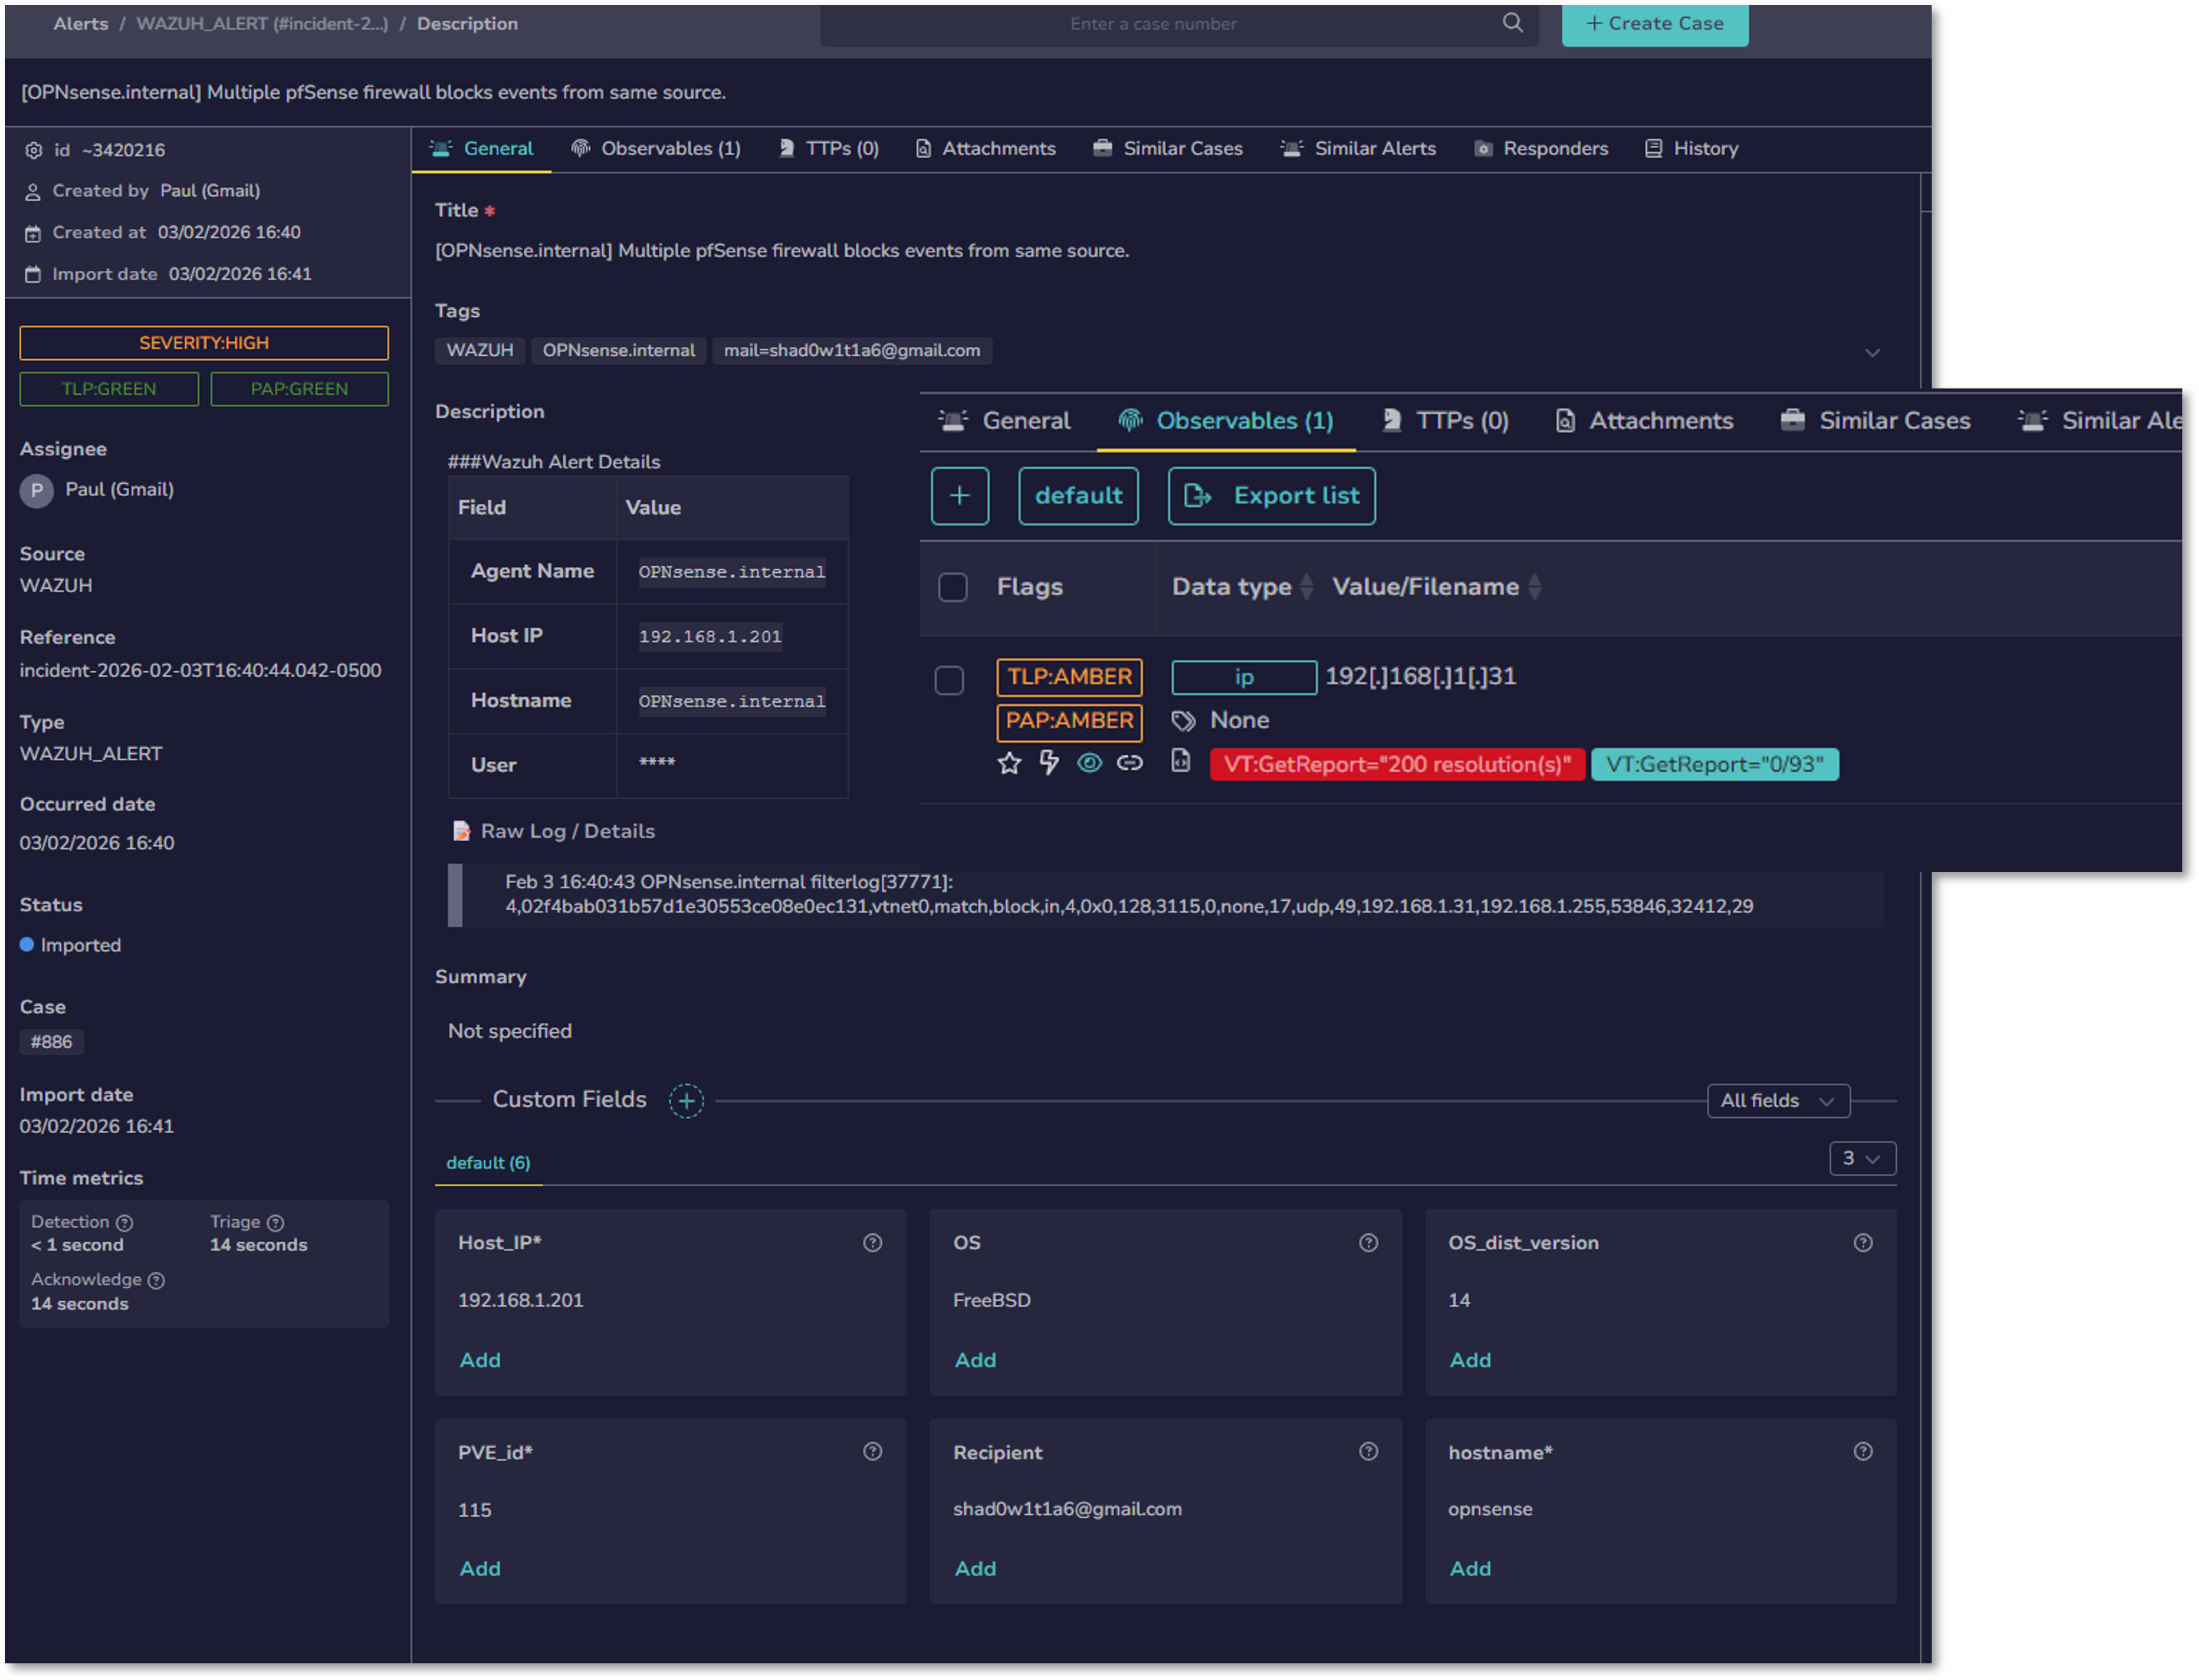
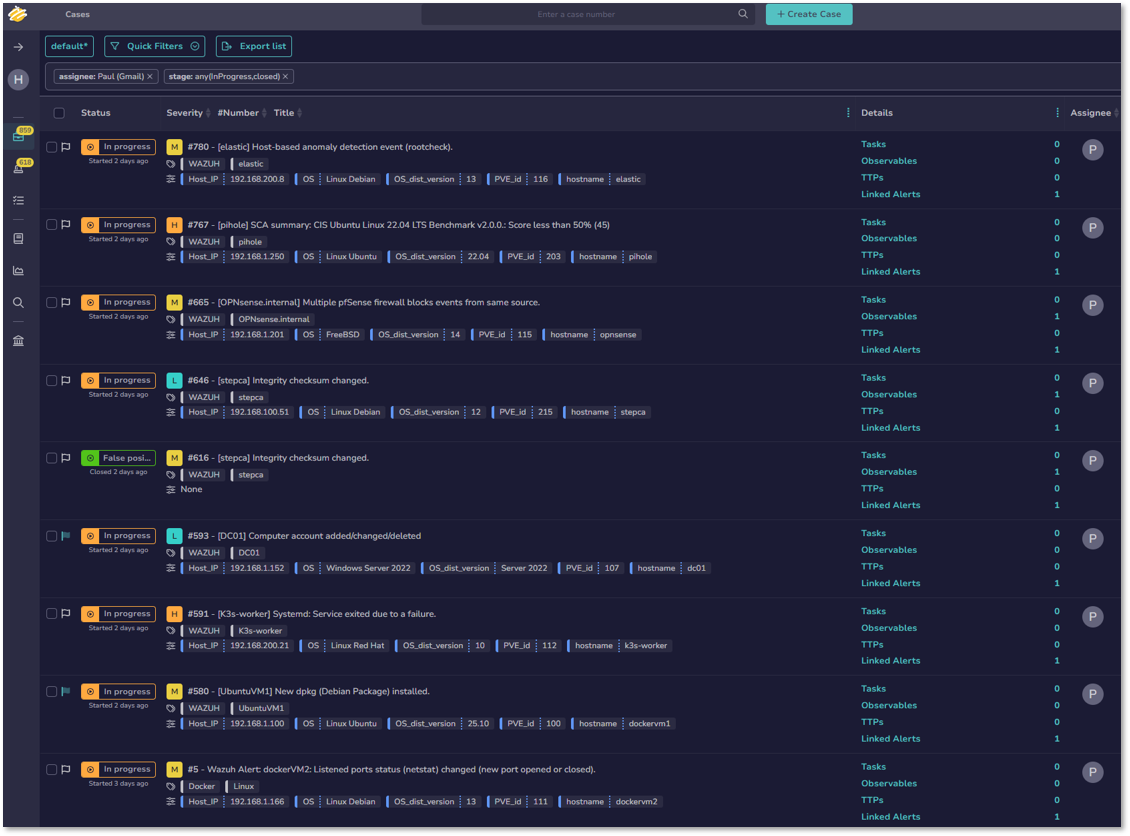
2. TheHive Integration
- CreateAlert: Generates alert in TheHive with Wazuh event metadata
- Add IP to Alert: Injects IP observables from alert
- Add Hash to Alert: Injects file hash observables from alert
- Create Case from Alert: Promotes alert to investigable case
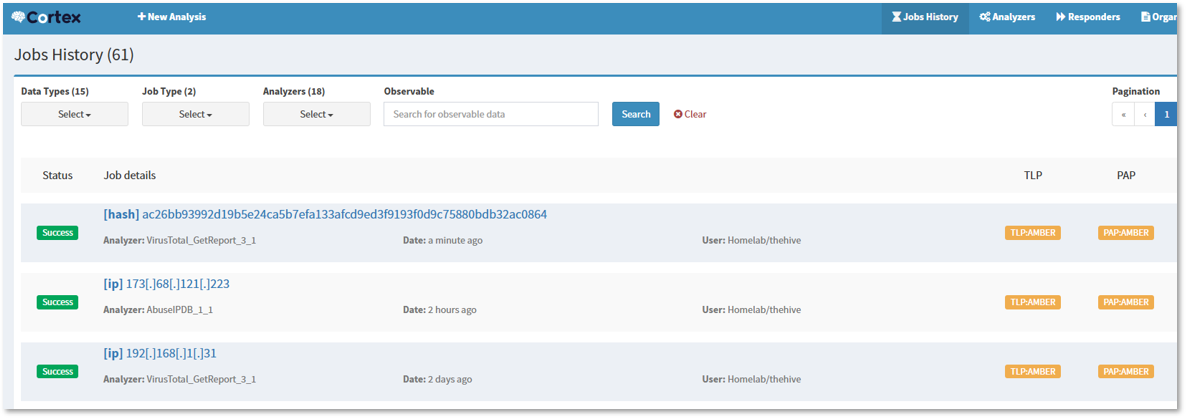
3. IOC Enrichment
- Get Case Observable: Retrieves all observables for analysis
- Run Analyzer VirusTotal: Executes VirusTotal_GetReport_3_1 via Cortex
- Run Analyzer AbuseIPDB: Executes AbuseIPDB_1_1 via Cortex
- Get Cortex Results: Retrieves analysis reports (JSON)
- Add Observable to Case: Attaches enrichment results to case
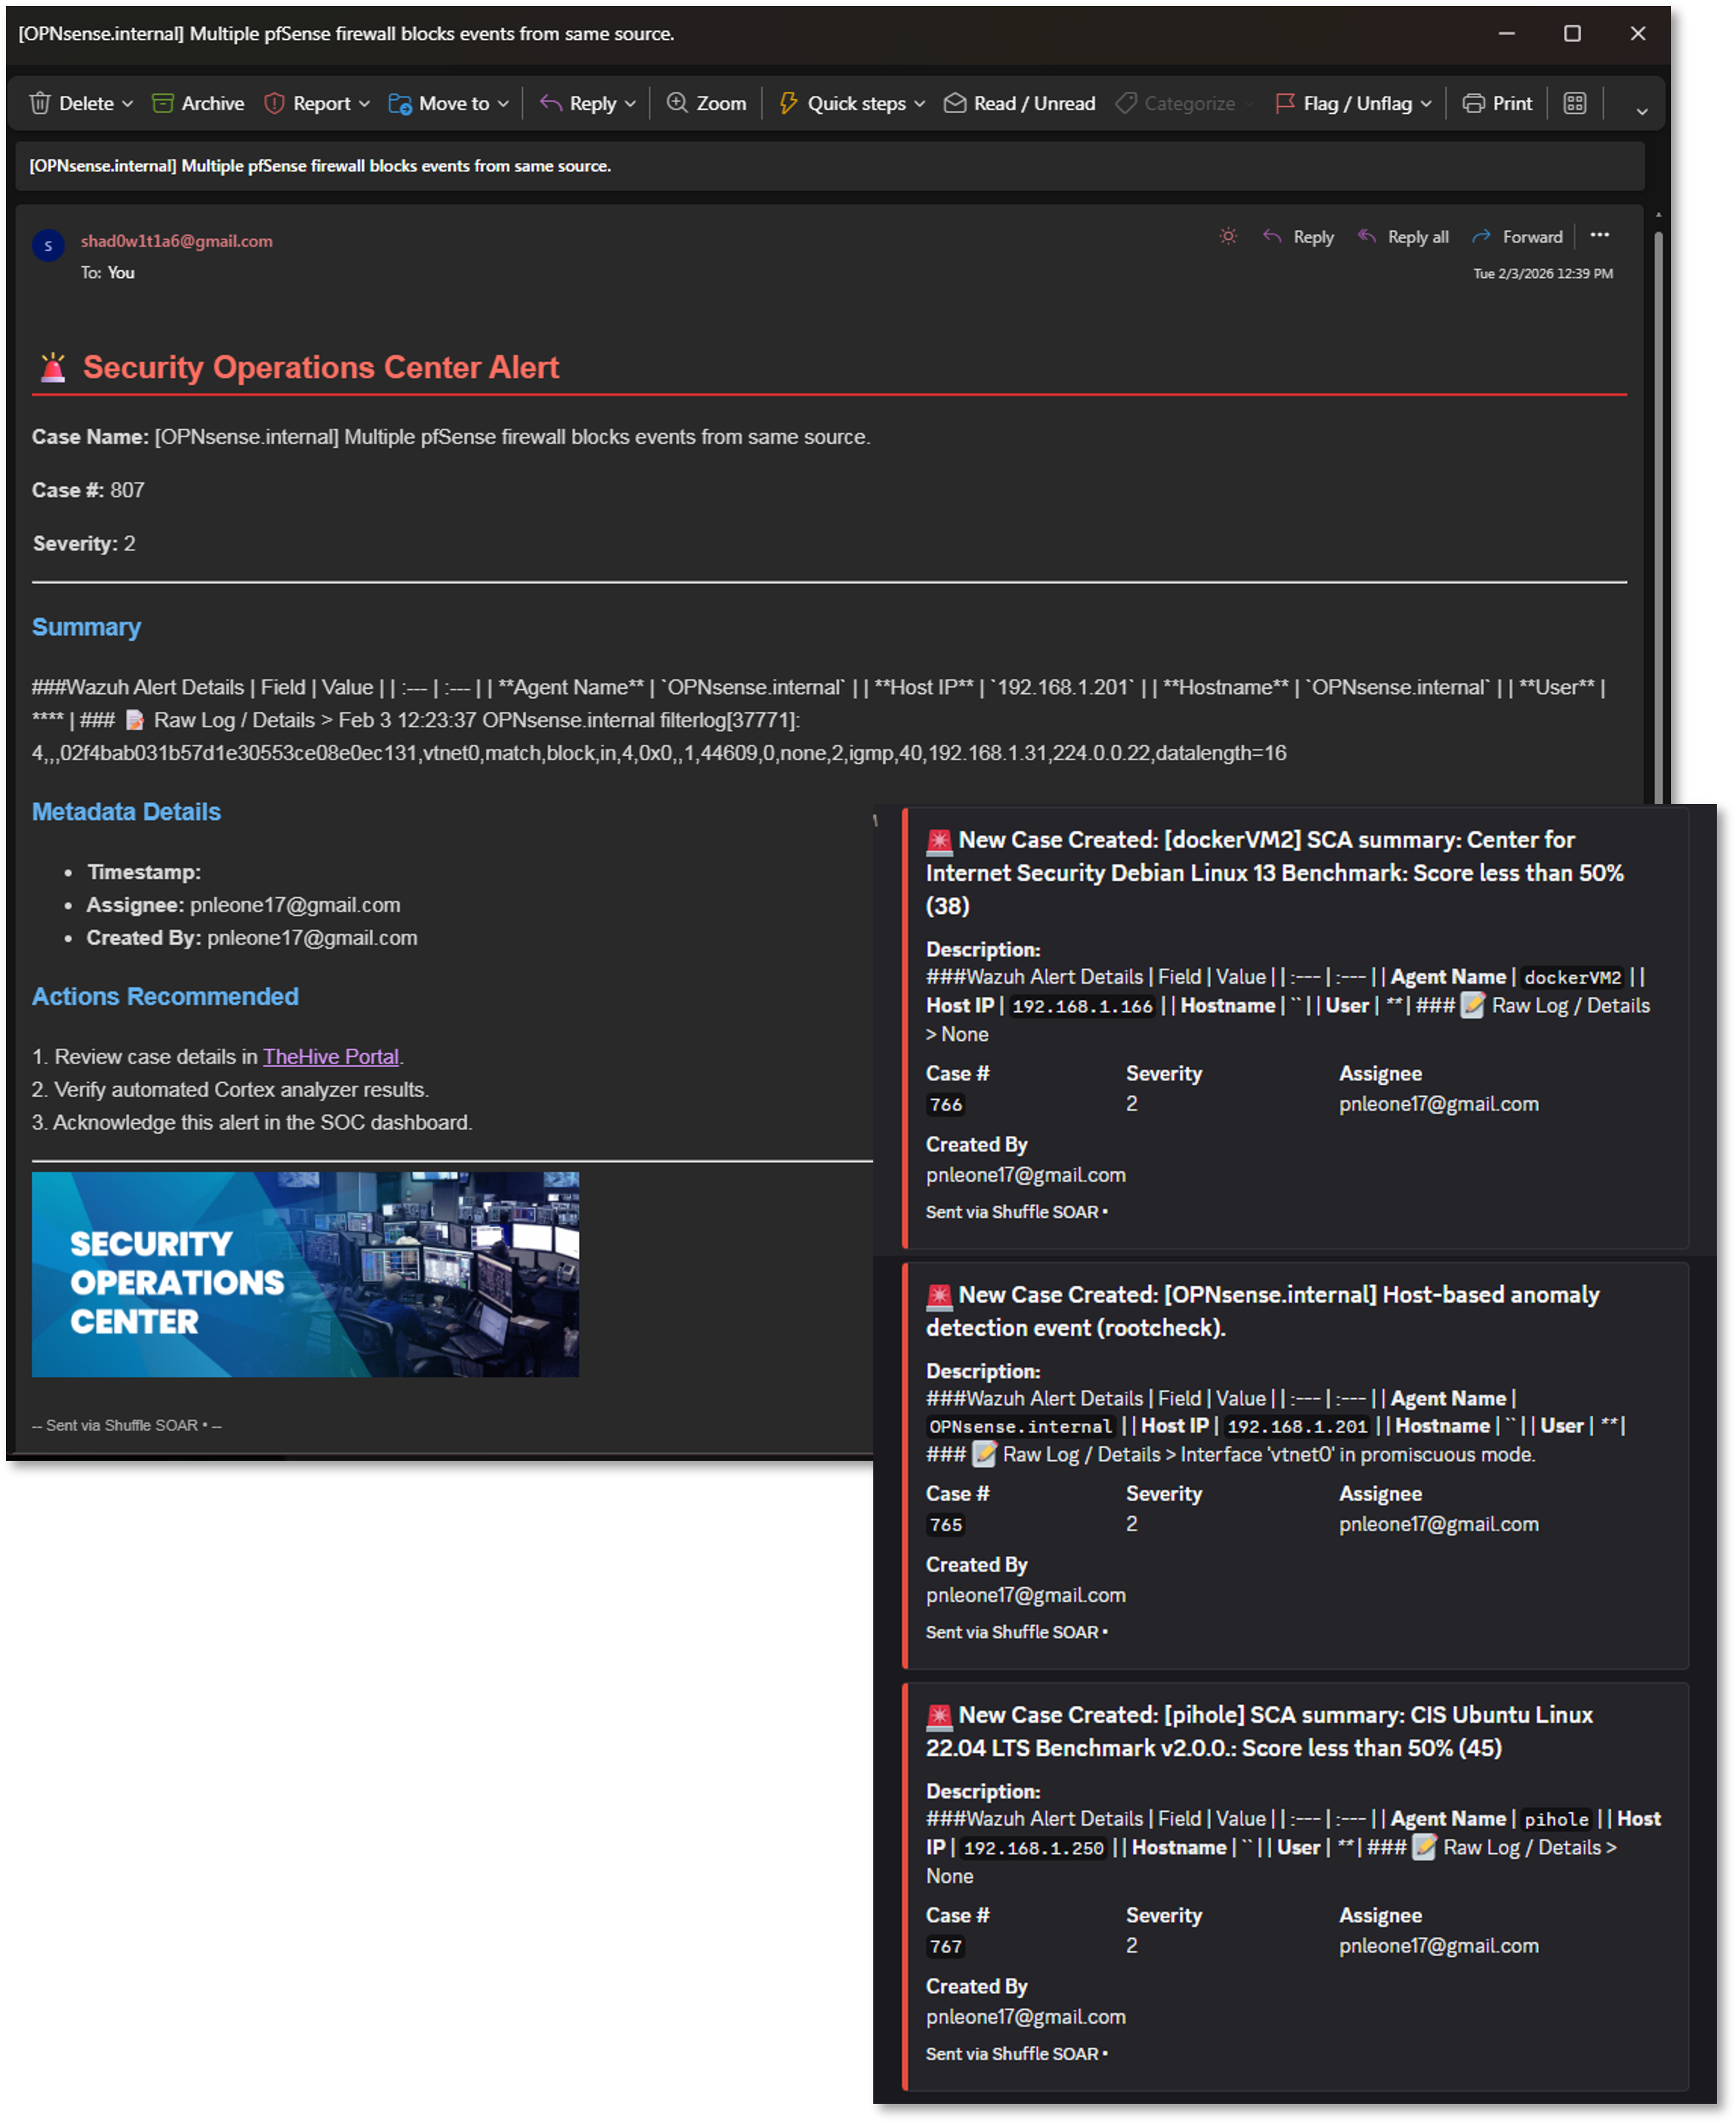
4. Notification
- Send Discord Alert: Pushes case summary to #soc-alerts channel
- Gmail Relay Notification: Emails SOC distribution list with case details
Use Case Example
Scenario: Wazuh detects suspicious process execution with SHA256 hash and external IP connection.
Automated Response:
- Case created in TheHive: [Hostname] Suspicious PowerShell Execution
- Cortex analysis results:
- VirusTotal: 45/70 detections (Trojan.Downloader)
- AbuseIPDB: IP flagged with 87% confidence score
- Discord/Email alerts sent with enrichment summary
- Analyst reviews case with pre-loaded context
Average Execution Time: 45-60 seconds
Workflow Screenshots
Observability Architecture
Deployment Overview
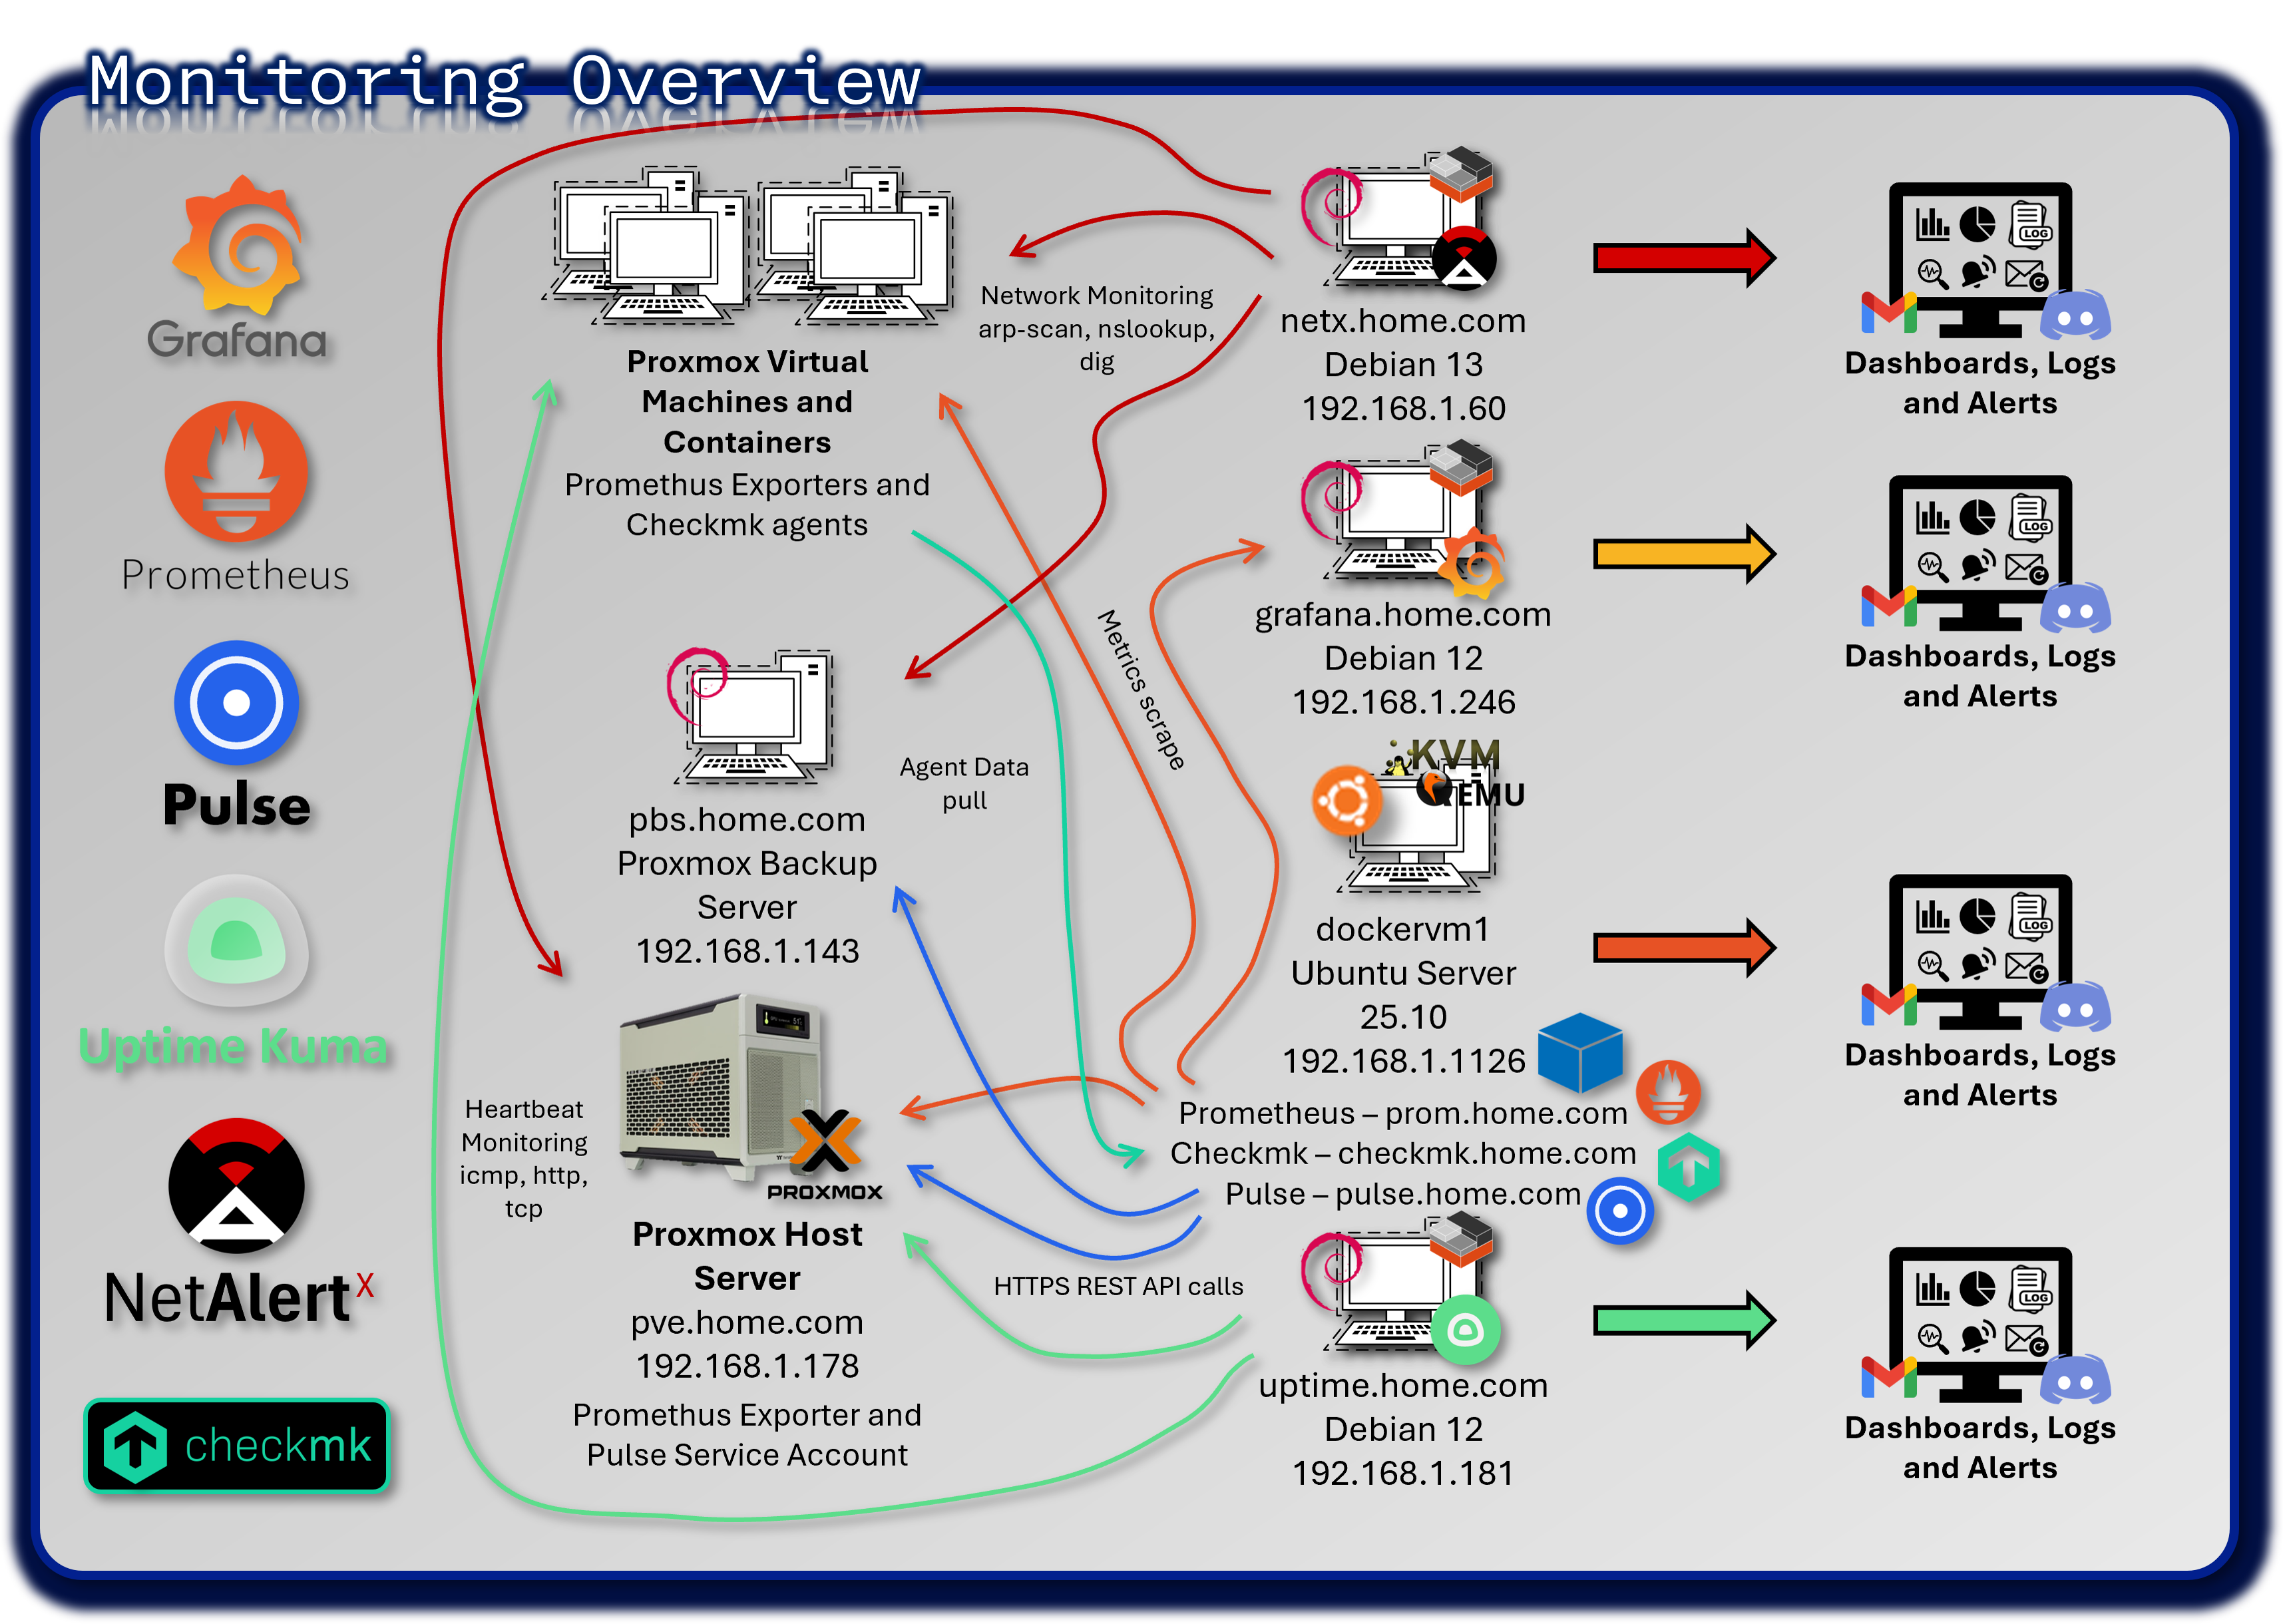
The monitoring stack provides comprehensive visibility into the health, performance, and availability of all systems across the lab environment. Unlike SIEM platforms that focus on security events, the monitoring layer captures operational telemetry: CPU, memory, disk, network throughput, service uptime, virtualization metrics, and application-level health checks.
This multi-tool architecture spans time-series metrics, heartbeat monitoring, deep infrastructure inspection, and hypervisor-specific analytics.
Security Impact
Monitoring is a critical component of operational security. Performance anomalies often precede or accompany security incidents—unexpected CPU spikes, abnormal network traffic, failing services, or resource exhaustion can indicate brute-force attempts, malware execution, or lateral movement. By correlating infrastructure telemetry with SIEM data, defenders gain a holistic view of system behavior.
Deployment Rationale
Modern environments require more than log-based security analytics; they require continuous operational awareness. This monitoring architecture demonstrates proficiency with enterprise-grade observability tools, hybrid infrastructure monitoring, and multi-channel alerting.
Architecture Principles Alignment
Defense in Depth:
- Multiple monitoring layers (metrics, uptime, hypervisor, infrastructure) ensure no single blind spot
- Redundant alerting channels prevent missed notifications
- Cross-tool correlation strengthens detection of operational anomalies
Secure by Design:
- TLS-secured communication for metrics and alerting pipelines
- Segmented monitoring networks reduce exposure of sensitive telemetry
- Centralized dashboards enforce consistent visibility
Zero Trust:
- No host or service is implicitly trusted; all must report health and availability
- Continuous validation of service uptime and performance
- Alerting pipelines enforce accountability and traceability
Prometheus & Grafana - Infrastructure Metrics Platform
Deployment Overview
Prometheus collects high-resolution time-series metrics from servers, containers, network devices, and applications. Grafana visualizes these metrics through customizable dashboards, providing real-time insights into system performance and long-term trends.
This stack focuses on operational telemetry—CPU, memory, disk I/O, network throughput, container health, and service latency—complementing SIEM platforms by monitoring performance rather than security events.
Security Impact
- Detects resource exhaustion attacks (CPU spikes, memory leaks, disk saturation)
- Identifies anomalous network throughput that may indicate data exfiltration
- Monitors container and Kubernetes health for signs of compromise
- Provides early warning when security tools (SIEM, EDR, IDS) degrade or fail
Deployment Rationale
Prometheus and Grafana are industry-standard observability tools used across cloud-native and hybrid environments. Their inclusion demonstrates proficiency with metrics-driven monitoring, dashboard creation, alerting rules, and containerized instrumentation.
Architecture Principles Alignment
Defense in Depth: Metrics complement logs and endpoint telemetry for multi-layer detection
Secure by Design: TLS-secured Prometheus endpoints; role-based Grafana access
Zero Trust: Every host must expose metrics; no implicit trust in service health
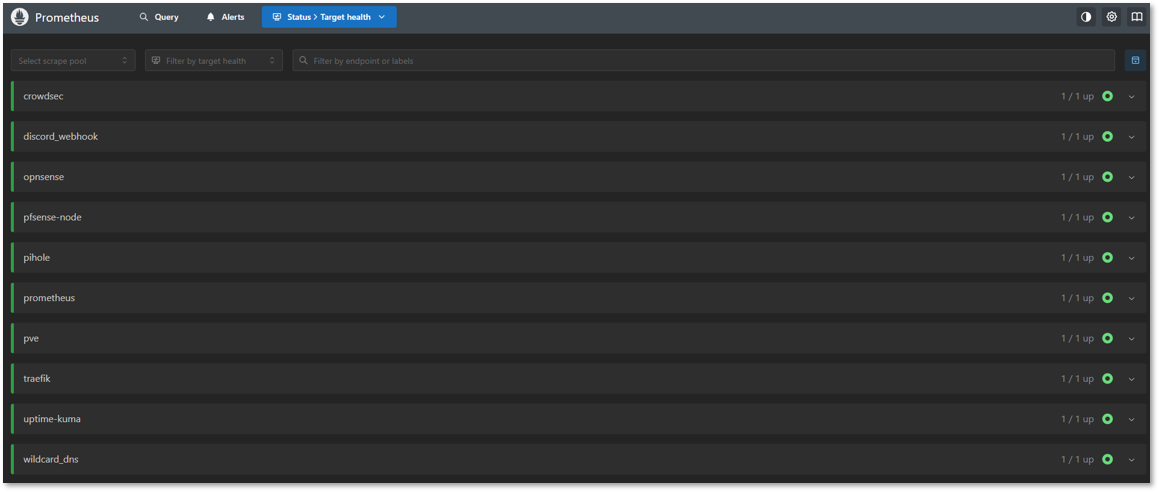
Prometheus Configuration
Core Prometheus:
- Labels: prom, pve, pihole
- Intervals: 1m
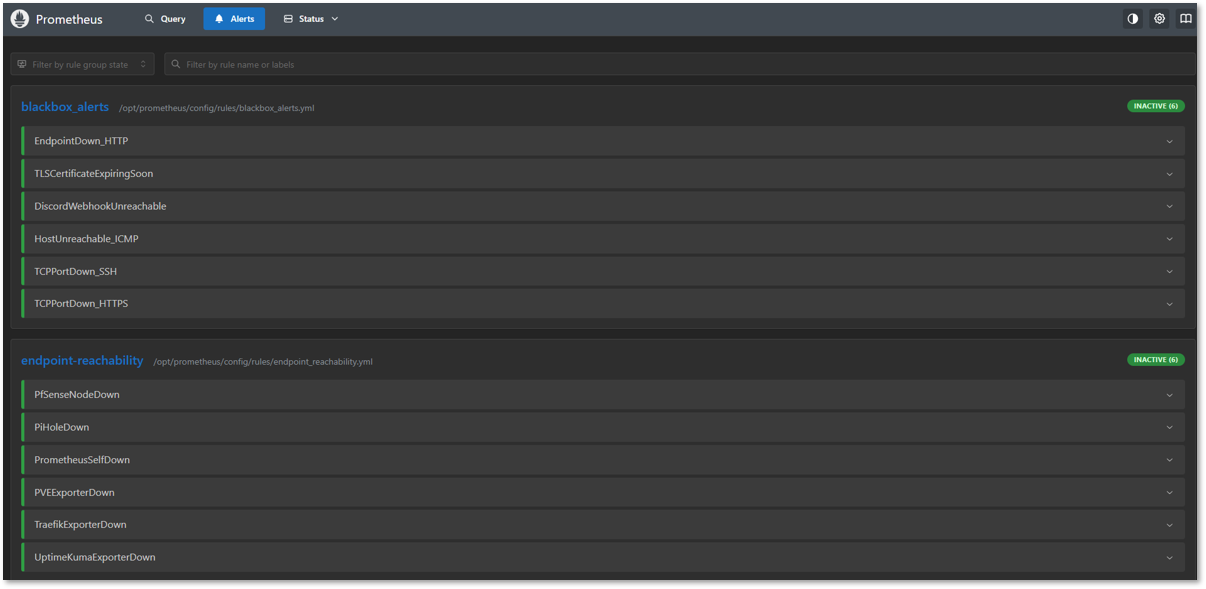
Alert Manager and Blackbox:
- Notifications and Discord integration
Exporters:
- Node Exporter: Linux hosts (PVE node, VMs, Docker hosts)
- Proxmox Exporter: prometheus-pve-exporter hitting the PVE API
- Pi-hole Exporter: containerized exporter reading FTL metrics
- Traefik: reverse proxy details
- pfSense Exporter: system-level monitoring
- OPNsense Exporter: system-level monitoring
- Uptime-Kuma: Service uptime monitoring
- CrowdSec: Engine metrics
Grafana Dashboards
Infrastructure Dashboards:
| Dashboard Name | Data Source | Refresh Rate | Panels |
|---|---|---|---|
| Node Exporter Full | Prometheus | 30s | CPU; RAM; Disk; Network; Load |
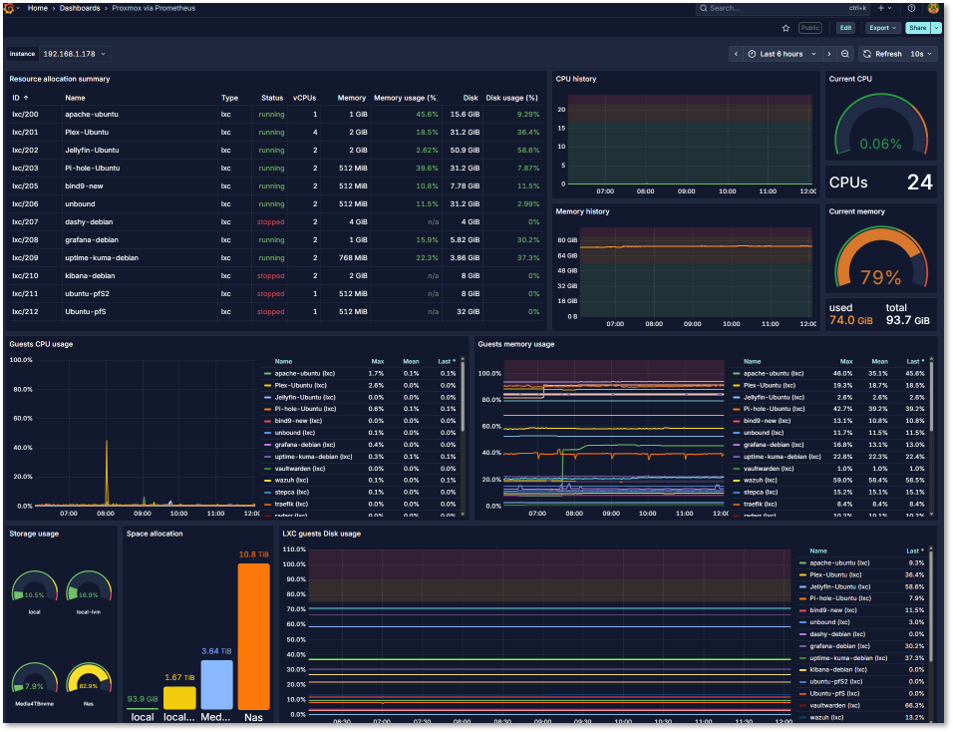
| Proxmox VE Overview | Prometheus | 1m | Cluster status; VM metrics; storage |
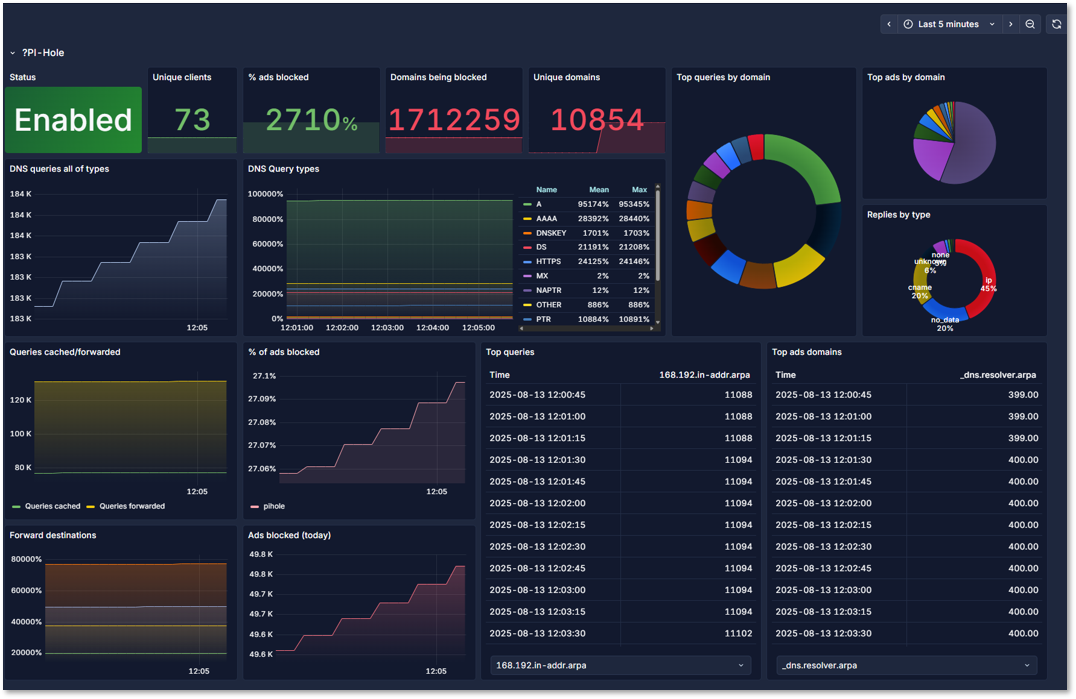
| Pi-hole Statistics | Prometheus | 30s | Query rate; block %; cache hits |
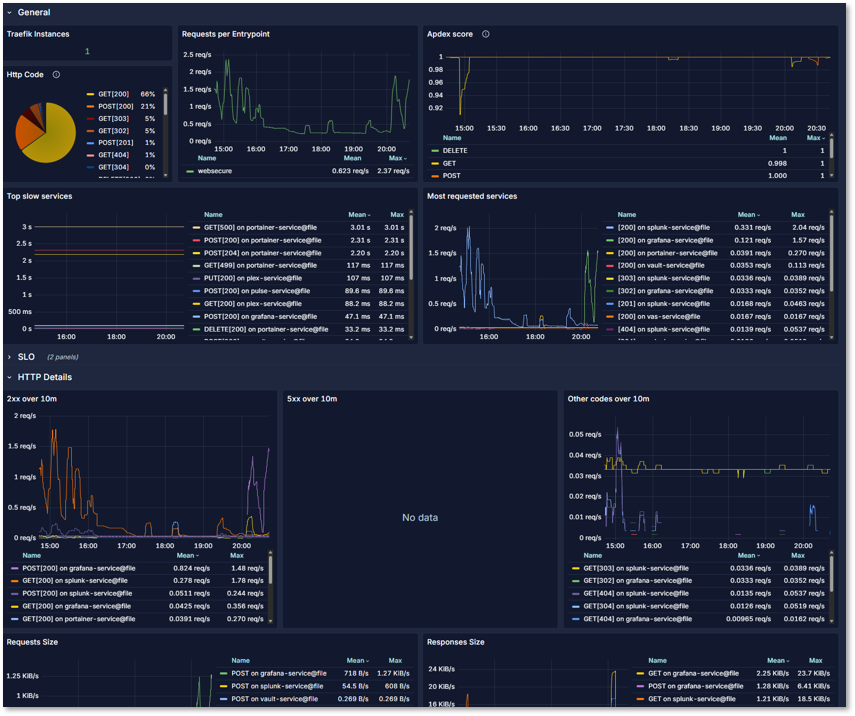
| Traefik Overview | Prometheus | 15s | Request rate; latency; error rate |
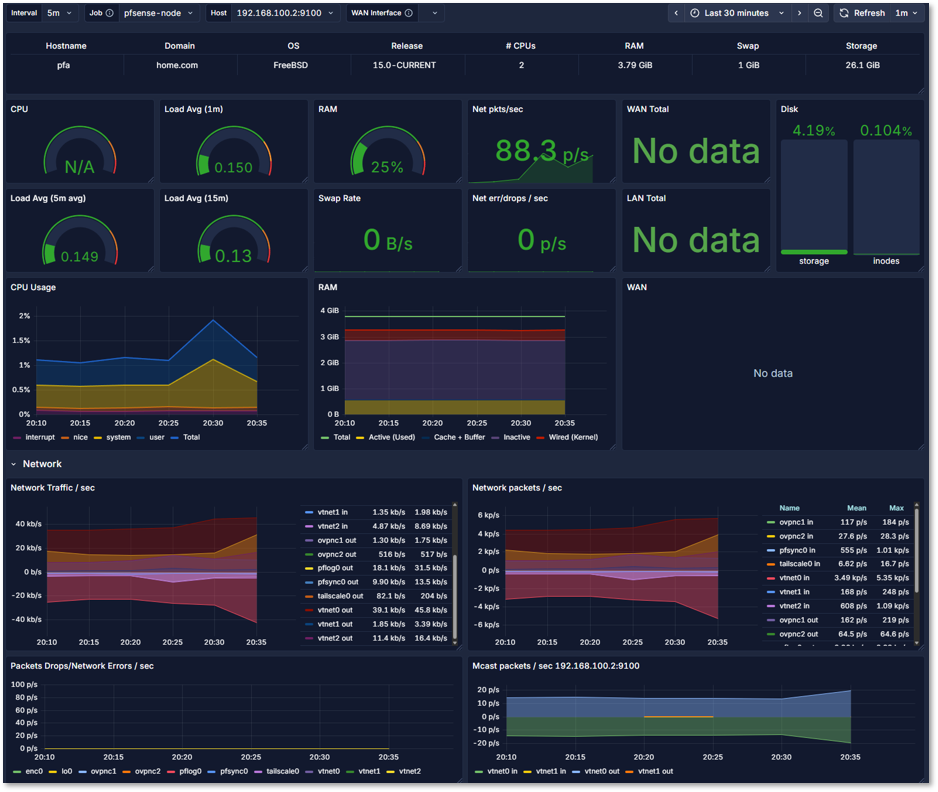
| pfSense System Metrics | Prometheus | 30s | CPU; RAM; interfaces; throughput |
| Blackbox Exporter | Prometheus | 1m | HTTP status; TLS cert expiry; latency |
Proxmox VE Dashboard:
- Exporter: prometheus-pve-exporter as a service; uses least-privilege PVE API token
- Metrics: Node/VM CPU, memory, storage pools, task failures, HA state
- Alerts:
- Node pressure: CPU > 85% for 10m, RAM > 90% for 5m
- Storage: Datastore free < 15%
- VM health: No metrics from a VM for > 5m (down)
Pi-hole Dashboard:
- Exporter: Containerized pihole_exporter reading FTL metrics
- Metrics: Query rate, block rate, cache hit %, upstream latency, gravity update age
- Alerts:
- FTL down: No scrape > 2m
- Block rate anomaly: Sudden drop to near 0% or spike > 95%
- Upstream failures: SERVFAIL/timeout ratio increases
Traefik Dashboard:
- Exporter: Direct Prometheus integration
- Metrics: Instances, HTTP requests per entrypoint, application and HTTP method, slow services
pfSense Dashboard:
- Exporter: Direct Prometheus integration
- Metrics: CPU, RAM, Disk monitoring, network packets by interface, pkt/sec, load avg, traps and system calls
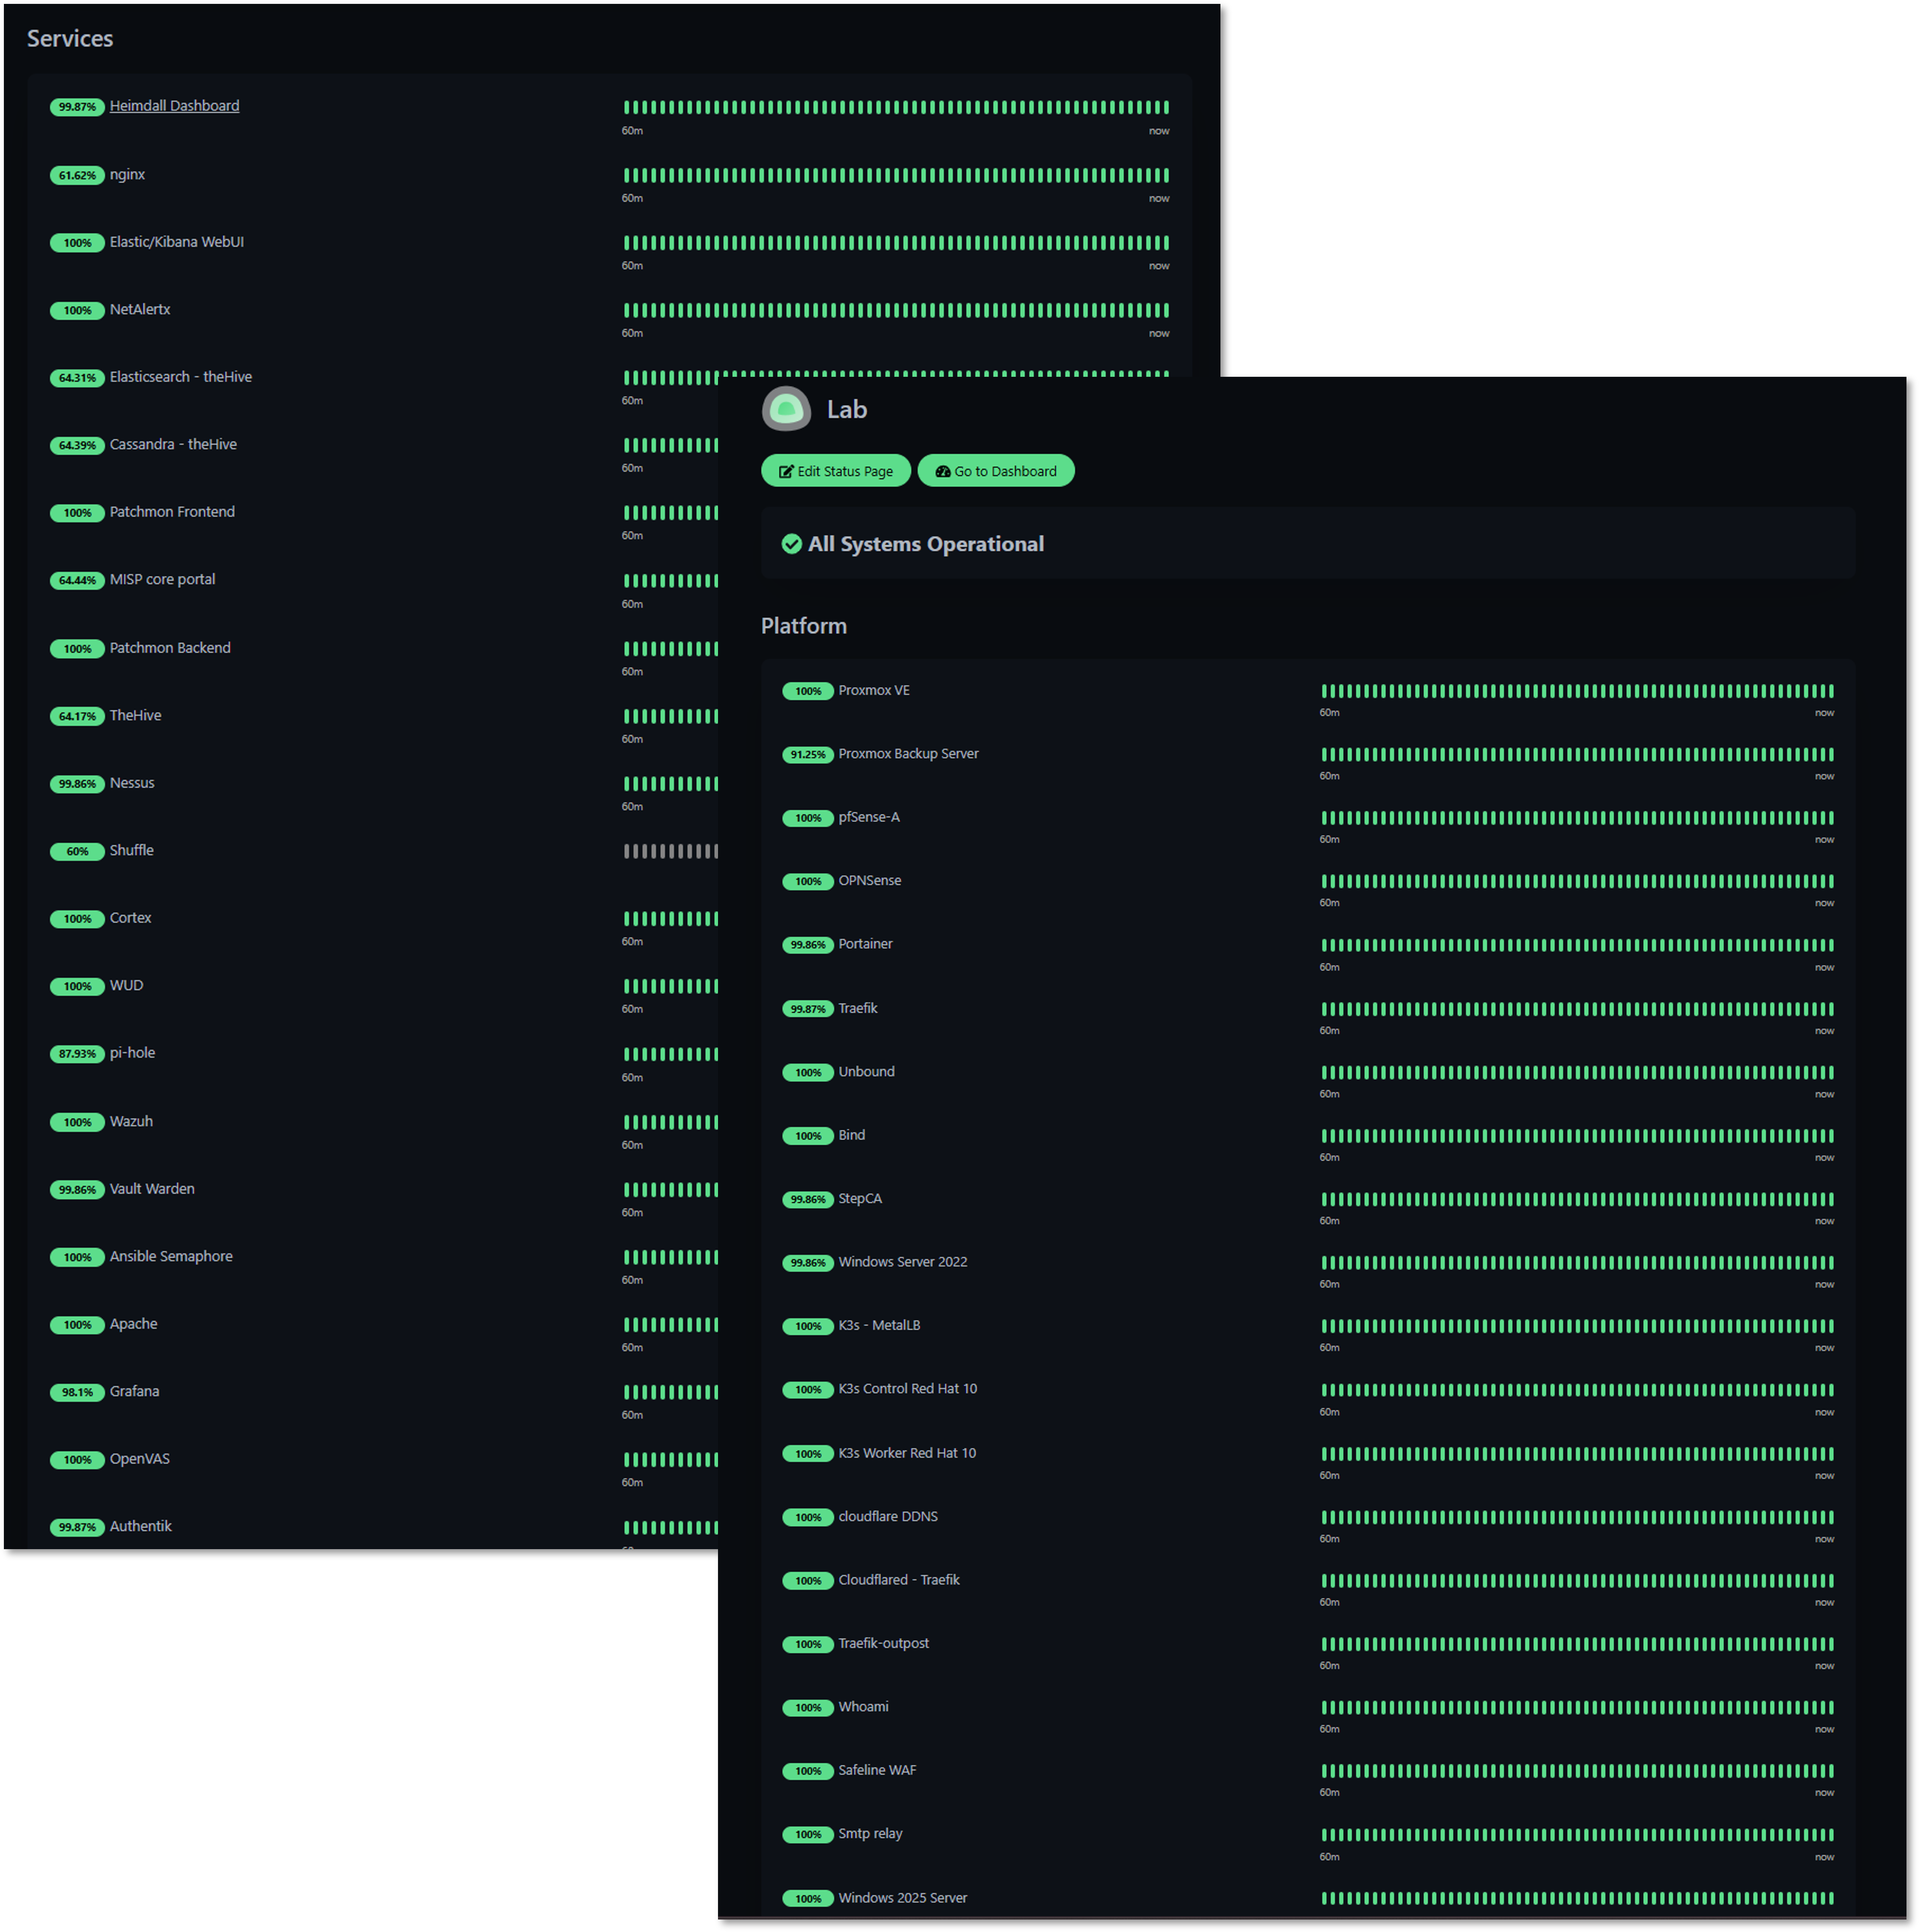
Uptime Kuma - Service Availability Monitoring
Deployment Overview
Uptime Kuma provides heartbeat monitoring for all lab services using HTTP/S, TCP, and ICMP checks. Each monitored service is continuously probed for availability, latency, and response integrity. Any deviation triggers immediate alerts routed to dedicated Discord channels.
Security Impact
- Detects service outages caused by attacks, misconfigurations, or resource exhaustion
- Identifies unstable or degraded services before they impact security tooling
- Provides uptime baselines useful for correlating with SIEM events
Deployment Rationale
Service uptime is foundational to both operational stability and security visibility. Uptime Kuma offers a lightweight, flexible, and highly responsive monitoring layer.
Architecture Principles Alignment
Defense in Depth: Adds availability monitoring to complement metrics and logs
Secure by Design: Segmented monitoring probes reduce attack surface
Zero Trust: No service is assumed healthy; continuous validation required
Checkmk - Deep Infrastructure Monitoring
Deployment Overview
Checkmk delivers comprehensive monitoring across servers, applications, network devices, storage systems, and containerized workloads.
Security Impact
- Detects abnormal system behavior (high load, failing disks, service crashes)
- Monitors critical infrastructure supporting security tools
- Provides granular visibility into multi-layer dependencies
Deployment Rationale
Checkmk represents enterprise-grade monitoring with agent-based and agentless capabilities. Its inclusion demonstrates proficiency with large-scale infrastructure monitoring, rule-based alerting, and hybrid environment observability.
Architecture Principles Alignment
Defense in Depth: Adds deep host-level inspection to complement Prometheus metrics
Secure by Design: Encrypted agent communication; strict role-based access
Zero Trust: Every host must report detailed health metrics continuously
High-Level Configuration
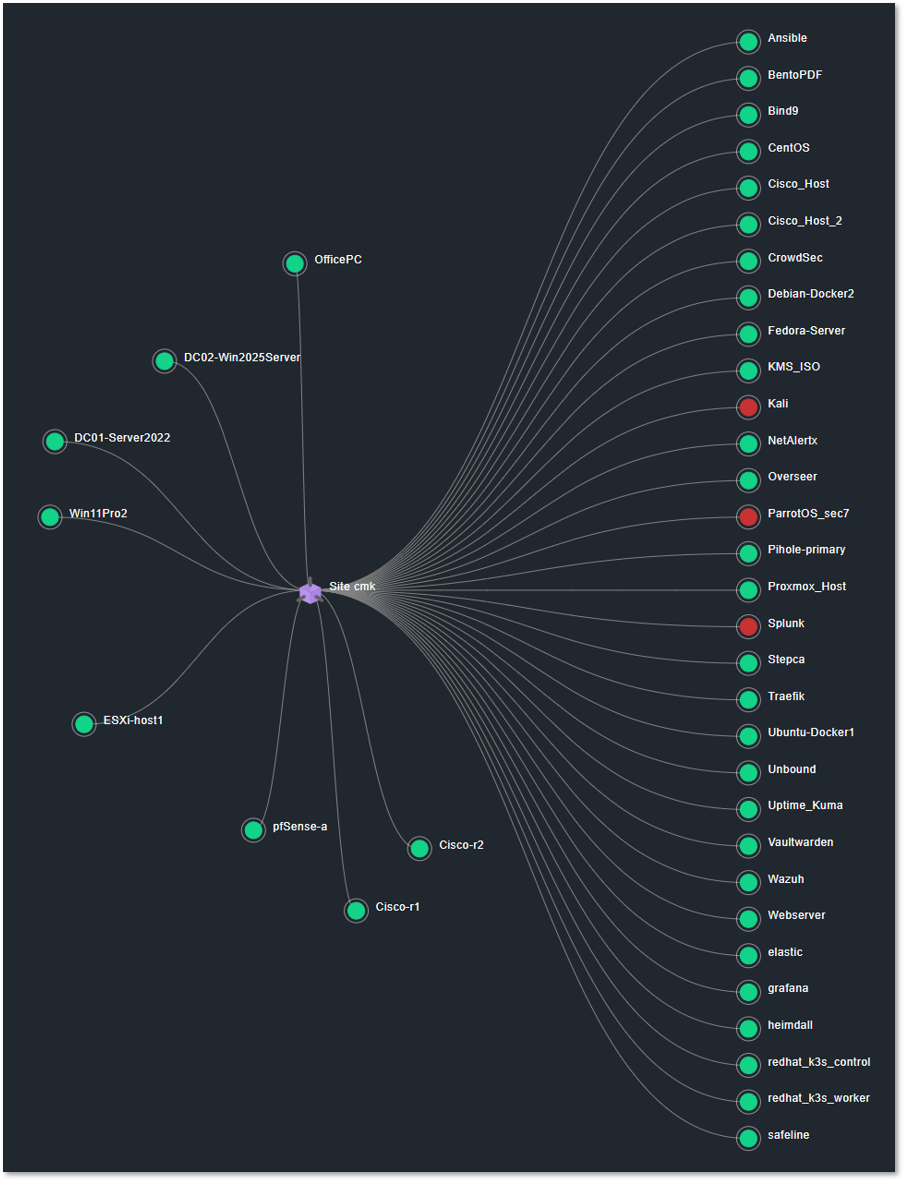
The Checkmk monitoring server runs as a Docker container on UbuntuVM1, which serves as the central monitoring engine for the entire homelab. UbuntuVM1 sits in the LAB_LAN1 VLAN and has direct or routed access to all monitored networks.
The Checkmk container communicates with monitored hosts using a mix of native Checkmk agents, SNMP, API integrations, and special agents depending on the platform.
Monitored Host Types & Integration Methods
Proxmox Host and Linux VMs/LXCs (Ubuntu, Debian, CentOS, Fedora, RHEL, Kali, ParrotOS):
- Integration: Checkmk Agent (TCP/6556)
- Metrics: CPU, memory, load, filesystem, systemd services, Docker containers, Kubernetes node metrics, application-specific checks
- Communication: Routed VLANs with firewall rules allowing TCP/6556 from UbuntuVM1
Windows Hosts (Win11, Server 2022, Server 2025):
- Integration: Checkmk Windows Agent
- Metrics: CPU, memory, disk, services, event log monitoring, Windows Update status, domain controller checks
pfSense Firewall:
- Integration: Checkmk Agent via xinetd (TCP/6556)
- Deployment: Agent deployed manually and served through xinetd, configured to start at boot using pfSense's shellcmd mechanism
- Metrics: System health (CPU, RAM, swap), interface throughput, gateway status, package health (Unbound, Suricata, Snort), filesystem usage
Cisco vIOS Routers (r1, r2):
- Integration: SNMP v2c
- Metrics: Interface status and traffic, errors/discards, CPU and memory, routing table size, ARP table, device uptime
VMware ESXi Host:
- Integration: VMware Special Agent (HTTPS/443)
- Authentication: Dedicated read-only user on ESXi host
- Metrics: Host CPU and memory, datastore usage, VM inventory and power state, NIC and vSwitch metrics
Communication Summary
| Host Type | Integration | Protocol | Notes |
|---|---|---|---|
| Linux servers | Checkmk Agent | TCP/6556 | Full OS visibility |
| Windows servers | Checkmk Agent | TCP/6556 | Event logs, services |
| pfSense | Checkmk Agent via xinetd | TCP/6556 | Custom deployment |
| Cisco vIOS | SNMP v2c | UDP/161 | Interface + routing metrics |
| ESXi | VMware Special Agent | HTTPS/443 | API-based monitoring |
| Proxmox | Checkmk Agent | TCP/6556 | Full OS visibility |
| Applications | Agent + HTTP checks | TCP/6556 + HTTP | Service-level monitoring |
Pulse - Proxmox Virtual Environment and Backup Server Monitoring
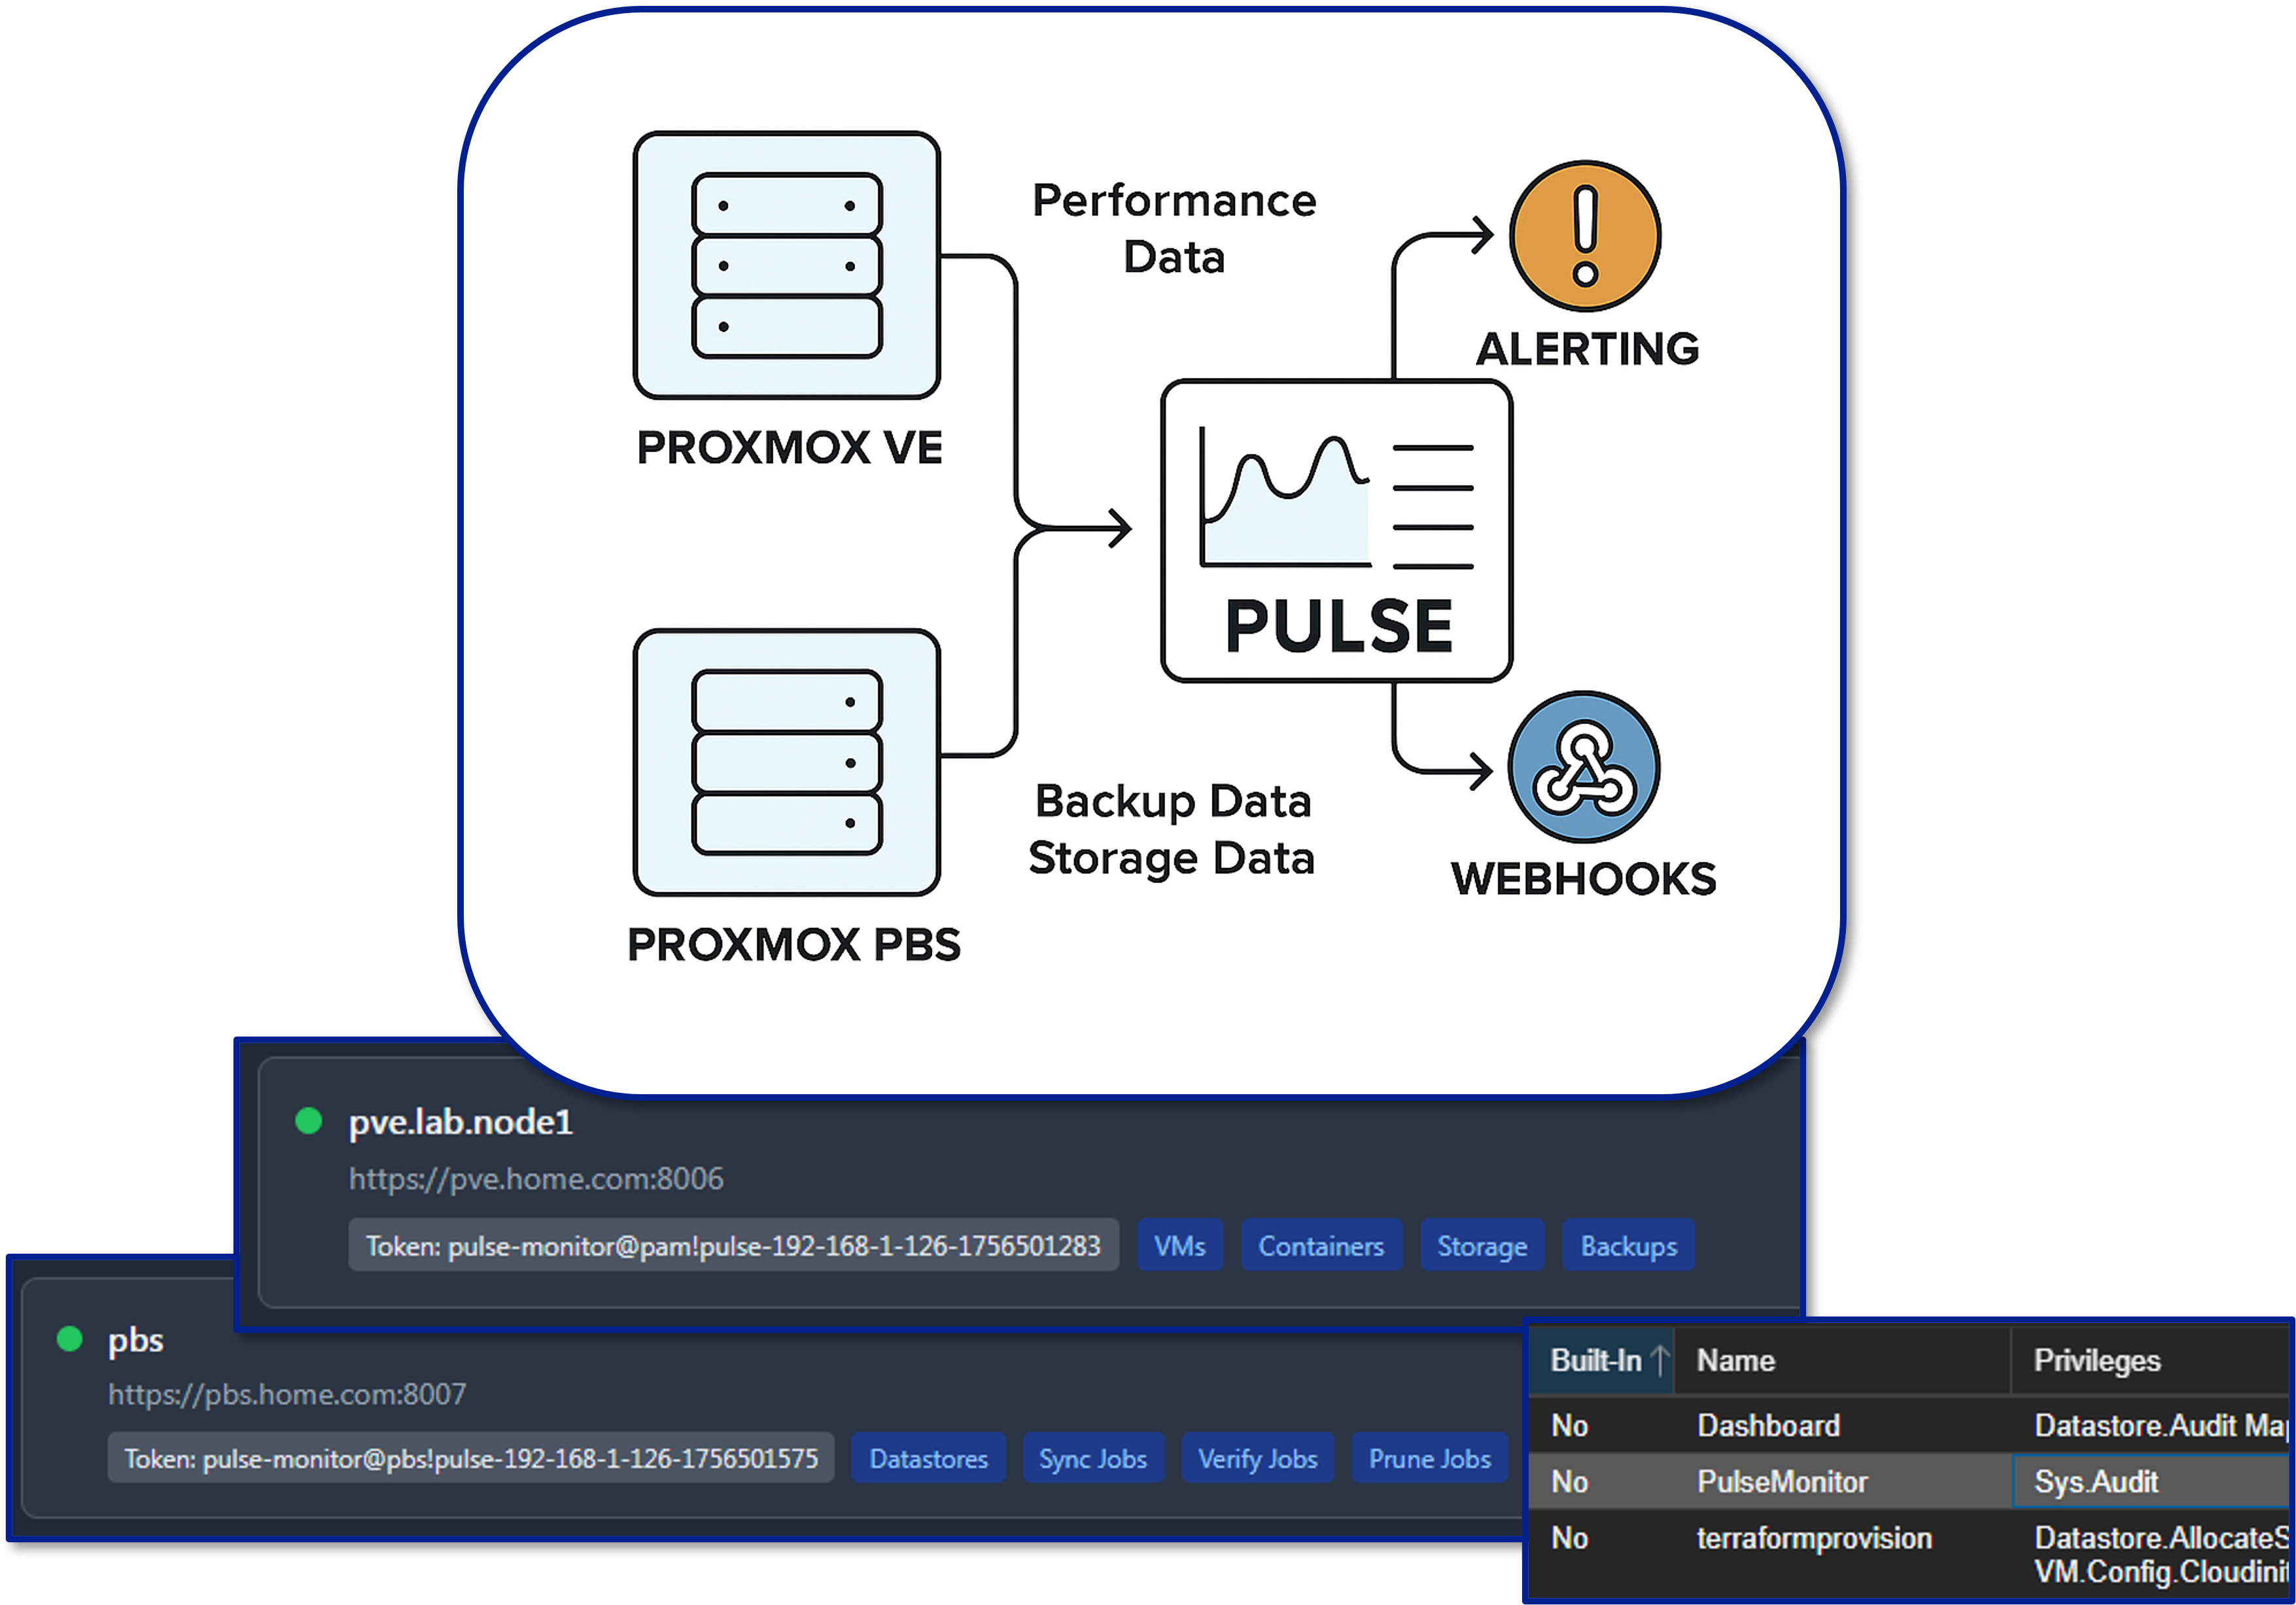
Deployment Overview
Pulse provides real-time monitoring and alerting specifically for Proxmox VE and Proxmox Backup Server. It consolidates hypervisor metrics—VM performance, storage health, cluster state, backup integrity—into a unified dashboard, enabling rapid situational awareness and proactive incident response.
Security Impact
- Detects hypervisor-level anomalies that may indicate compromise or misconfiguration
- Monitors VM performance for signs of malicious activity
- Ensures backup integrity and cluster stability
Deployment Rationale
Virtualization is the backbone of the lab environment. Pulse provides hypervisor-specific insights that general monitoring tools cannot, mirroring enterprise virtualization monitoring platforms.
Architecture Principles Alignment
Defense in Depth: Adds hypervisor-layer visibility beneath OS-level monitoring
Secure by Design: Dedicated monitoring channel reduces exposure of Proxmox APIs
Zero Trust: No VM or node is implicitly trusted; all must report health
Lab Integration
In this lab environment, Pulse is connected to both the Proxmox VE cluster and the PBS node. Authentication is handled via a dedicated Proxmox service account configured with an API token. This account is assigned minimal, read-only permissions required to:
- Query node, VM, and container status
- Retrieve backup job results
- Report on storage utilization
This least-privilege approach ensures that Pulse can monitor and report without having the ability to modify or disrupt the environment.
Dashboards
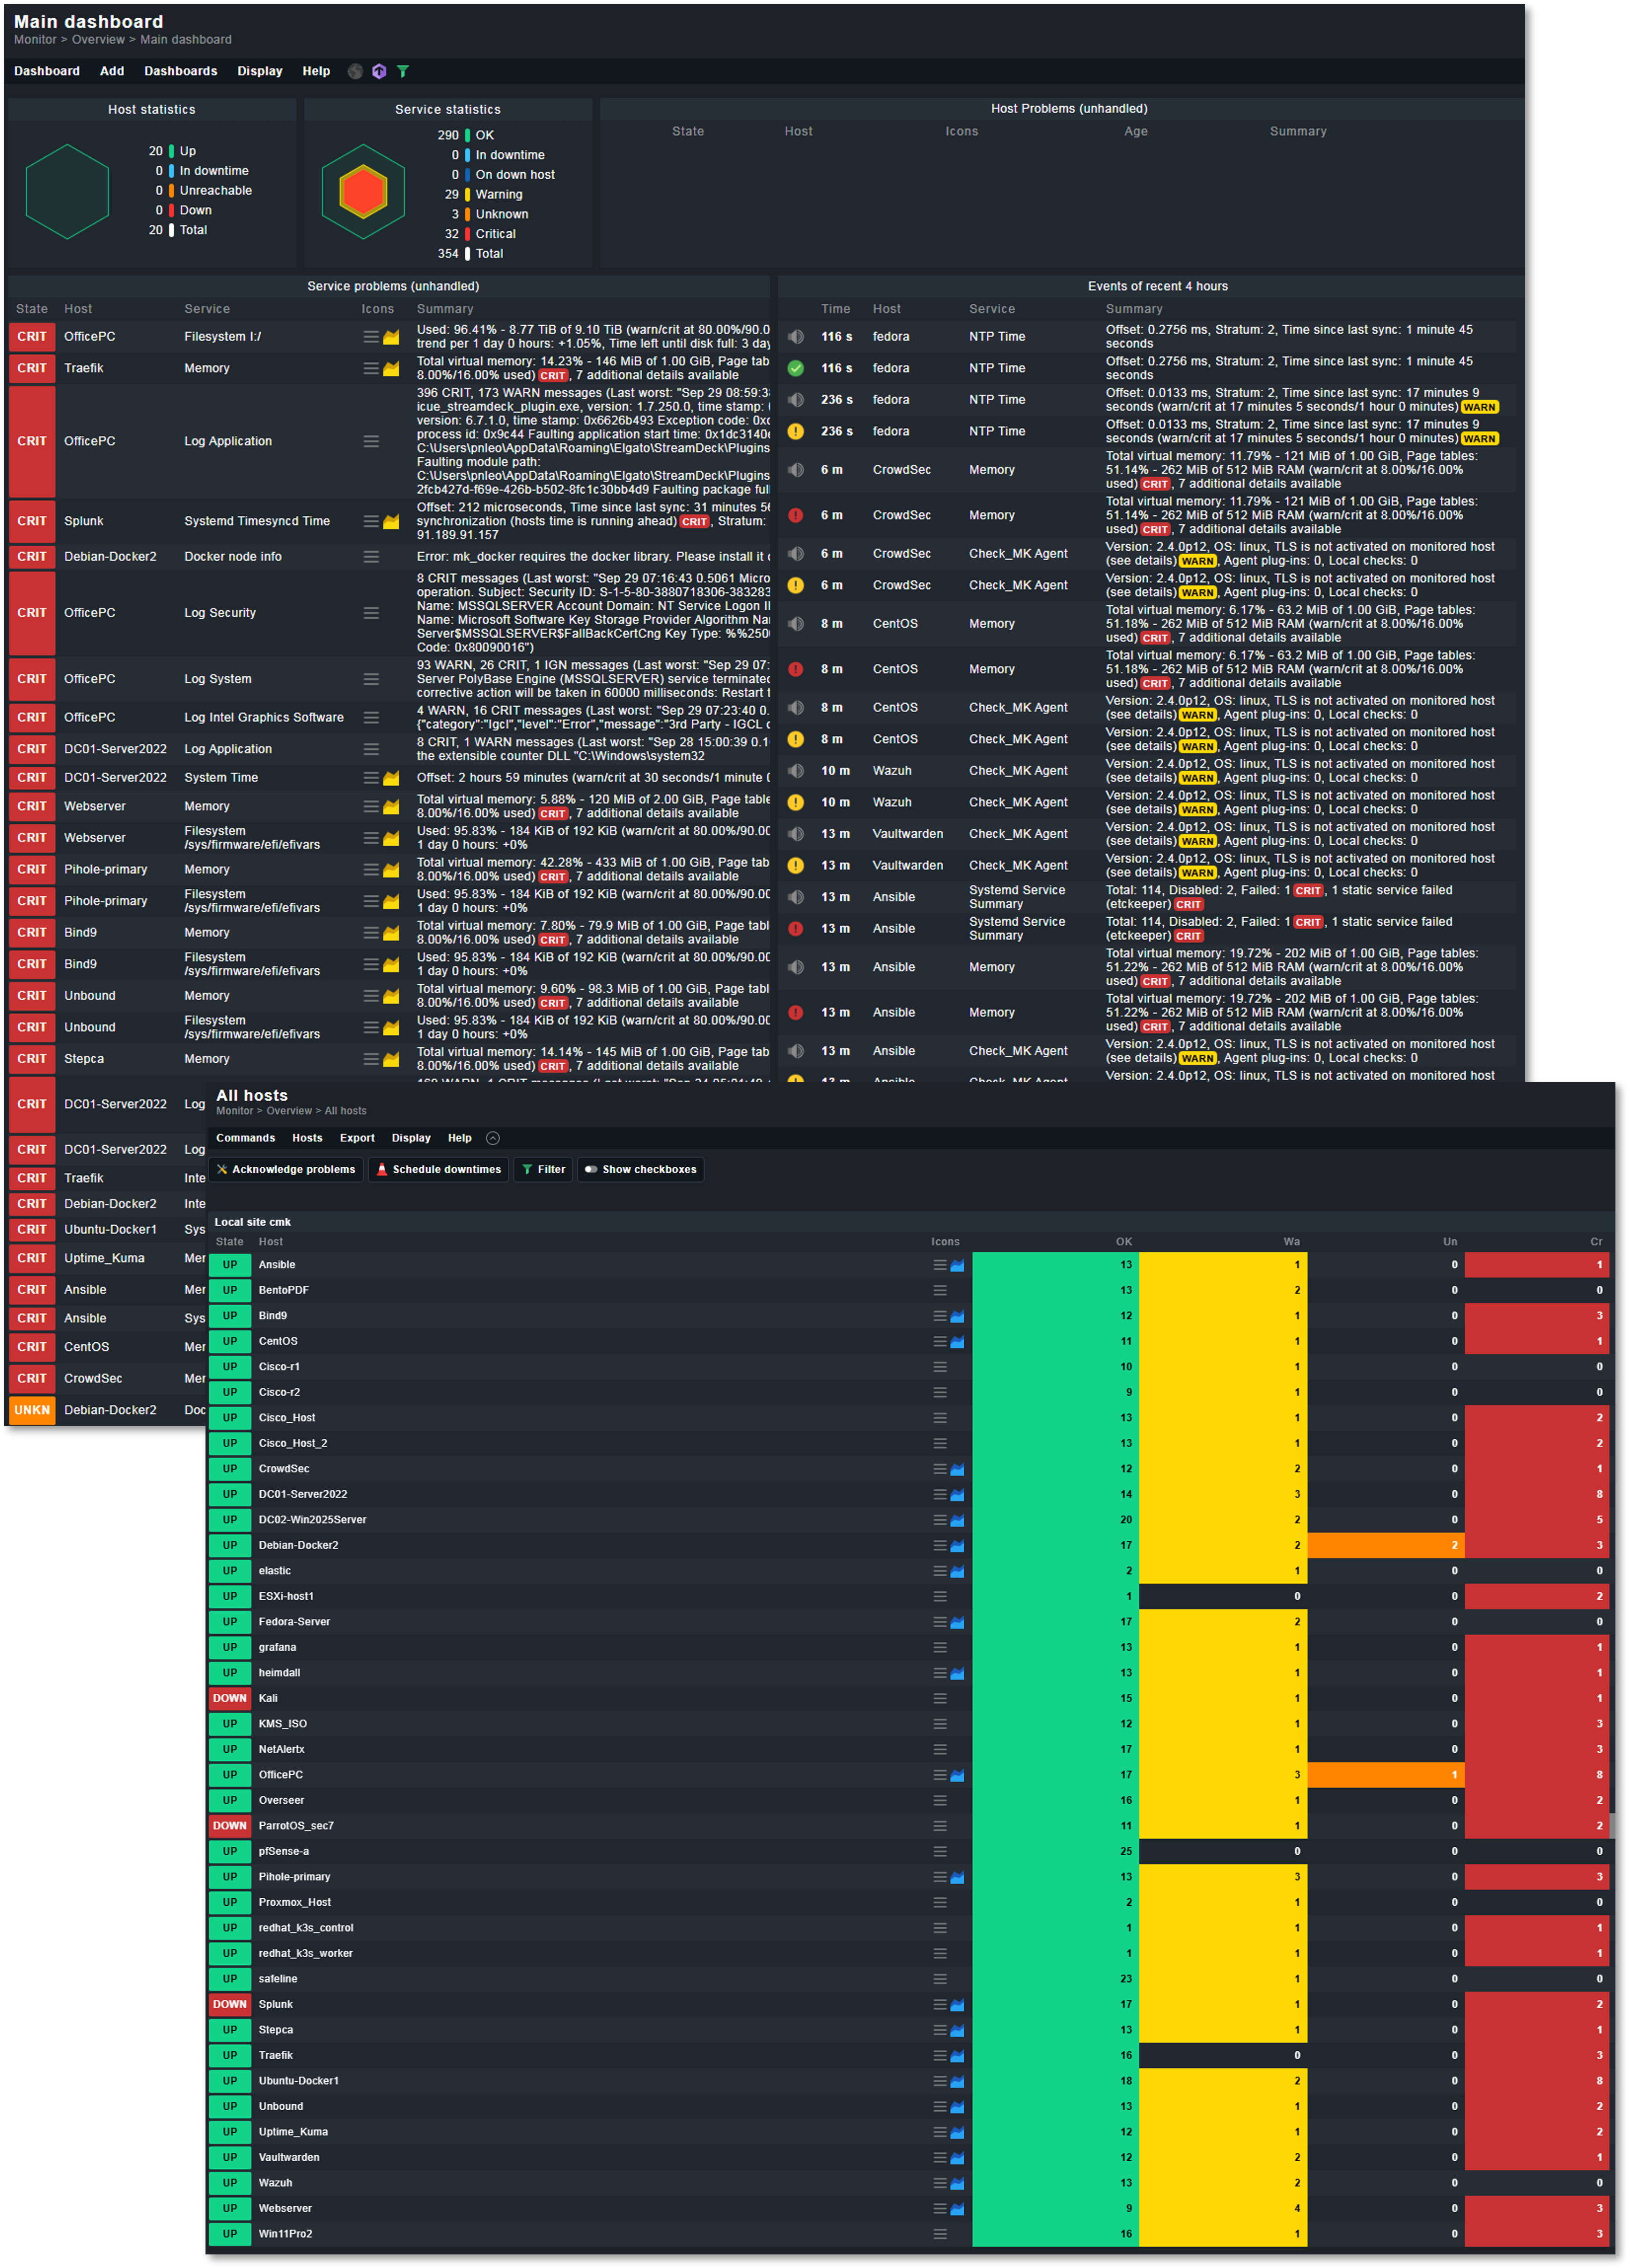
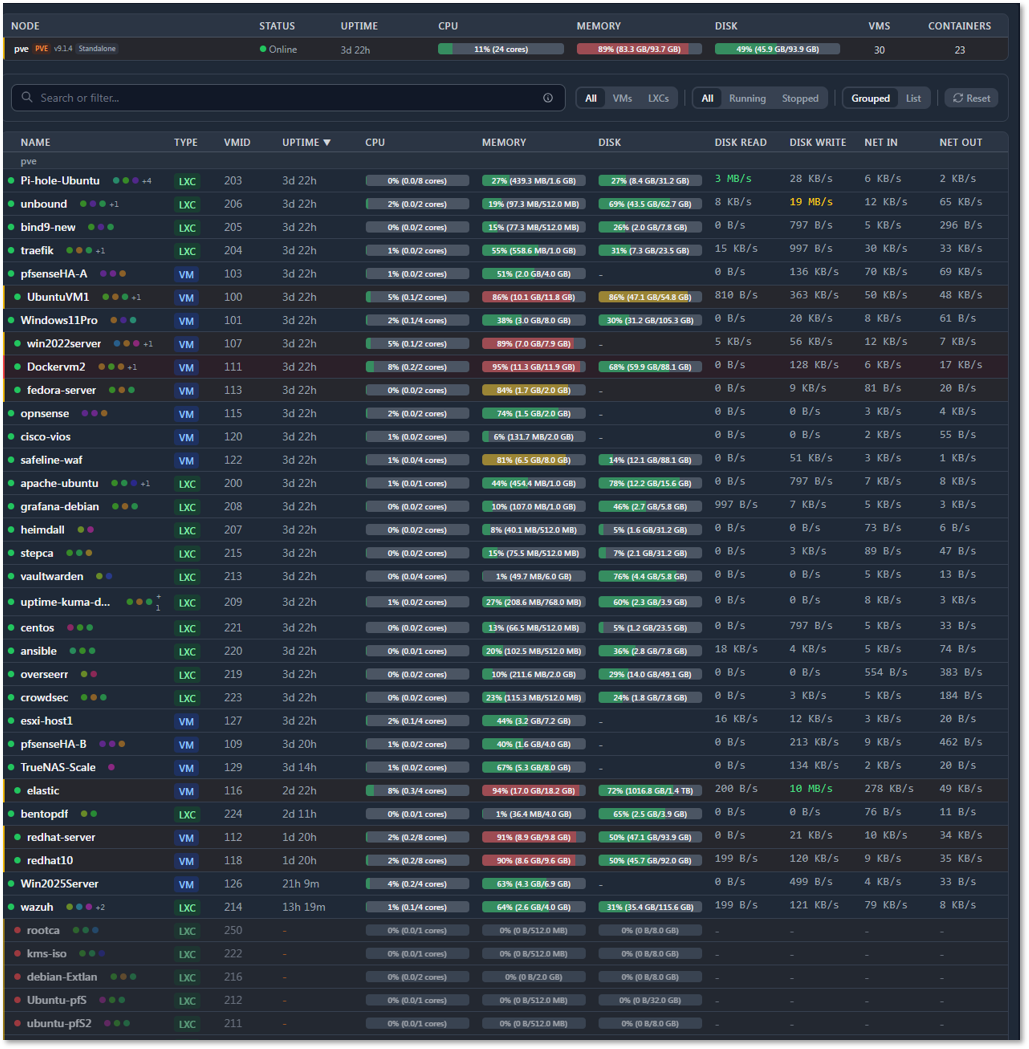
The Pulse main dashboard provides a real-time operational view of the Proxmox environment, including:
- Node statistics: CPU load, memory consumption, and storage usage for each Proxmox VE host
- Guest statistics: Resource usage for all deployed VMs and LXCs
- Visual threshold indicators: Color-coded gauges and bars highlight when usage approaches or exceeds configured limits
- Interactive webhooks: Clicking on a monitored service or resource can open its corresponding Proxmox web portal page for direct management
Example Use Cases:
- Proactive capacity planning: Identify nodes nearing CPU or memory saturation before performance degrades
- Backup compliance: Immediate notification if a PBS backup job fails, allowing for same-day remediation
- Storage health: Early warning when datastore usage trends toward capacity, preventing unexpected outages
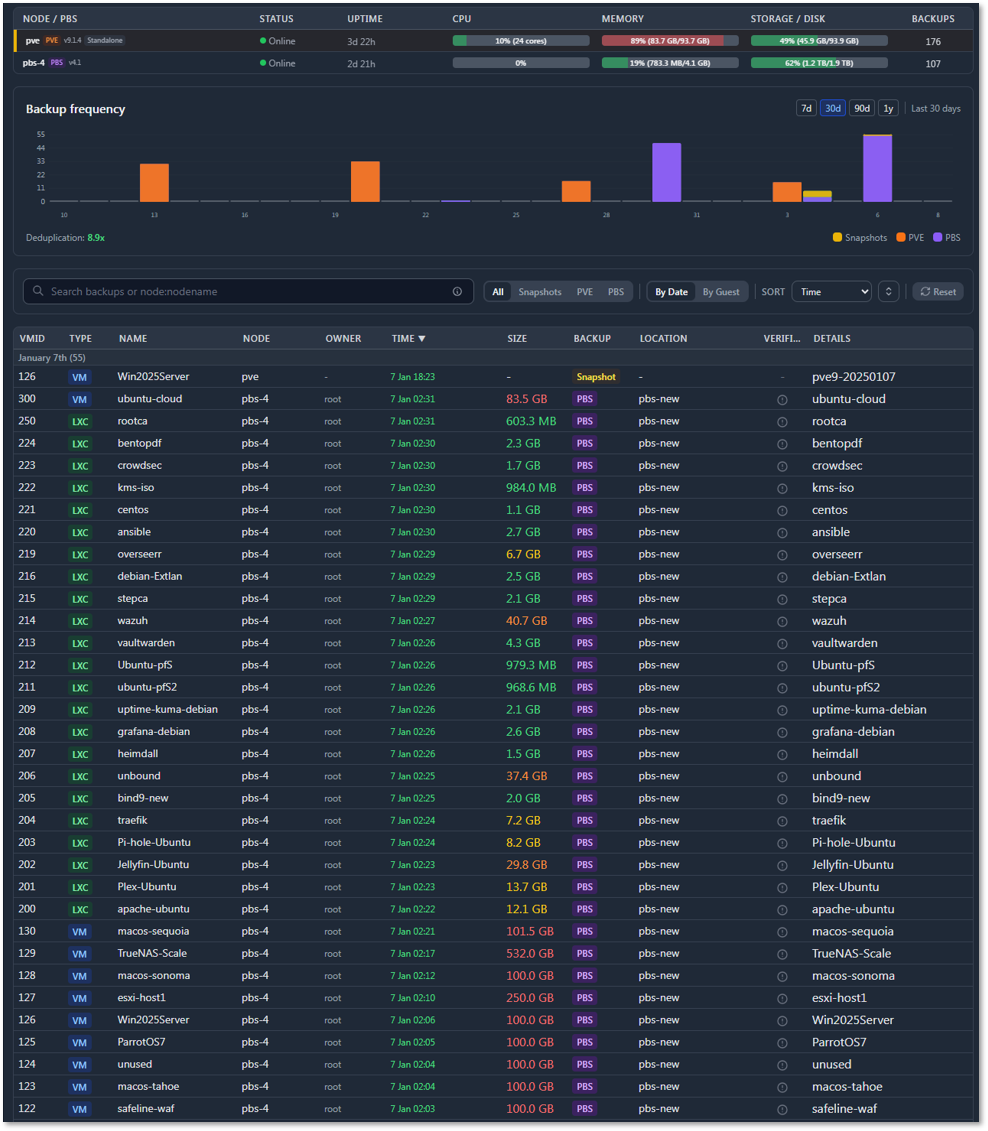
Backup Dashboard:
Reports on the various backup methods. The dashboard provides details on snapshot status and PBS status and history of backups.
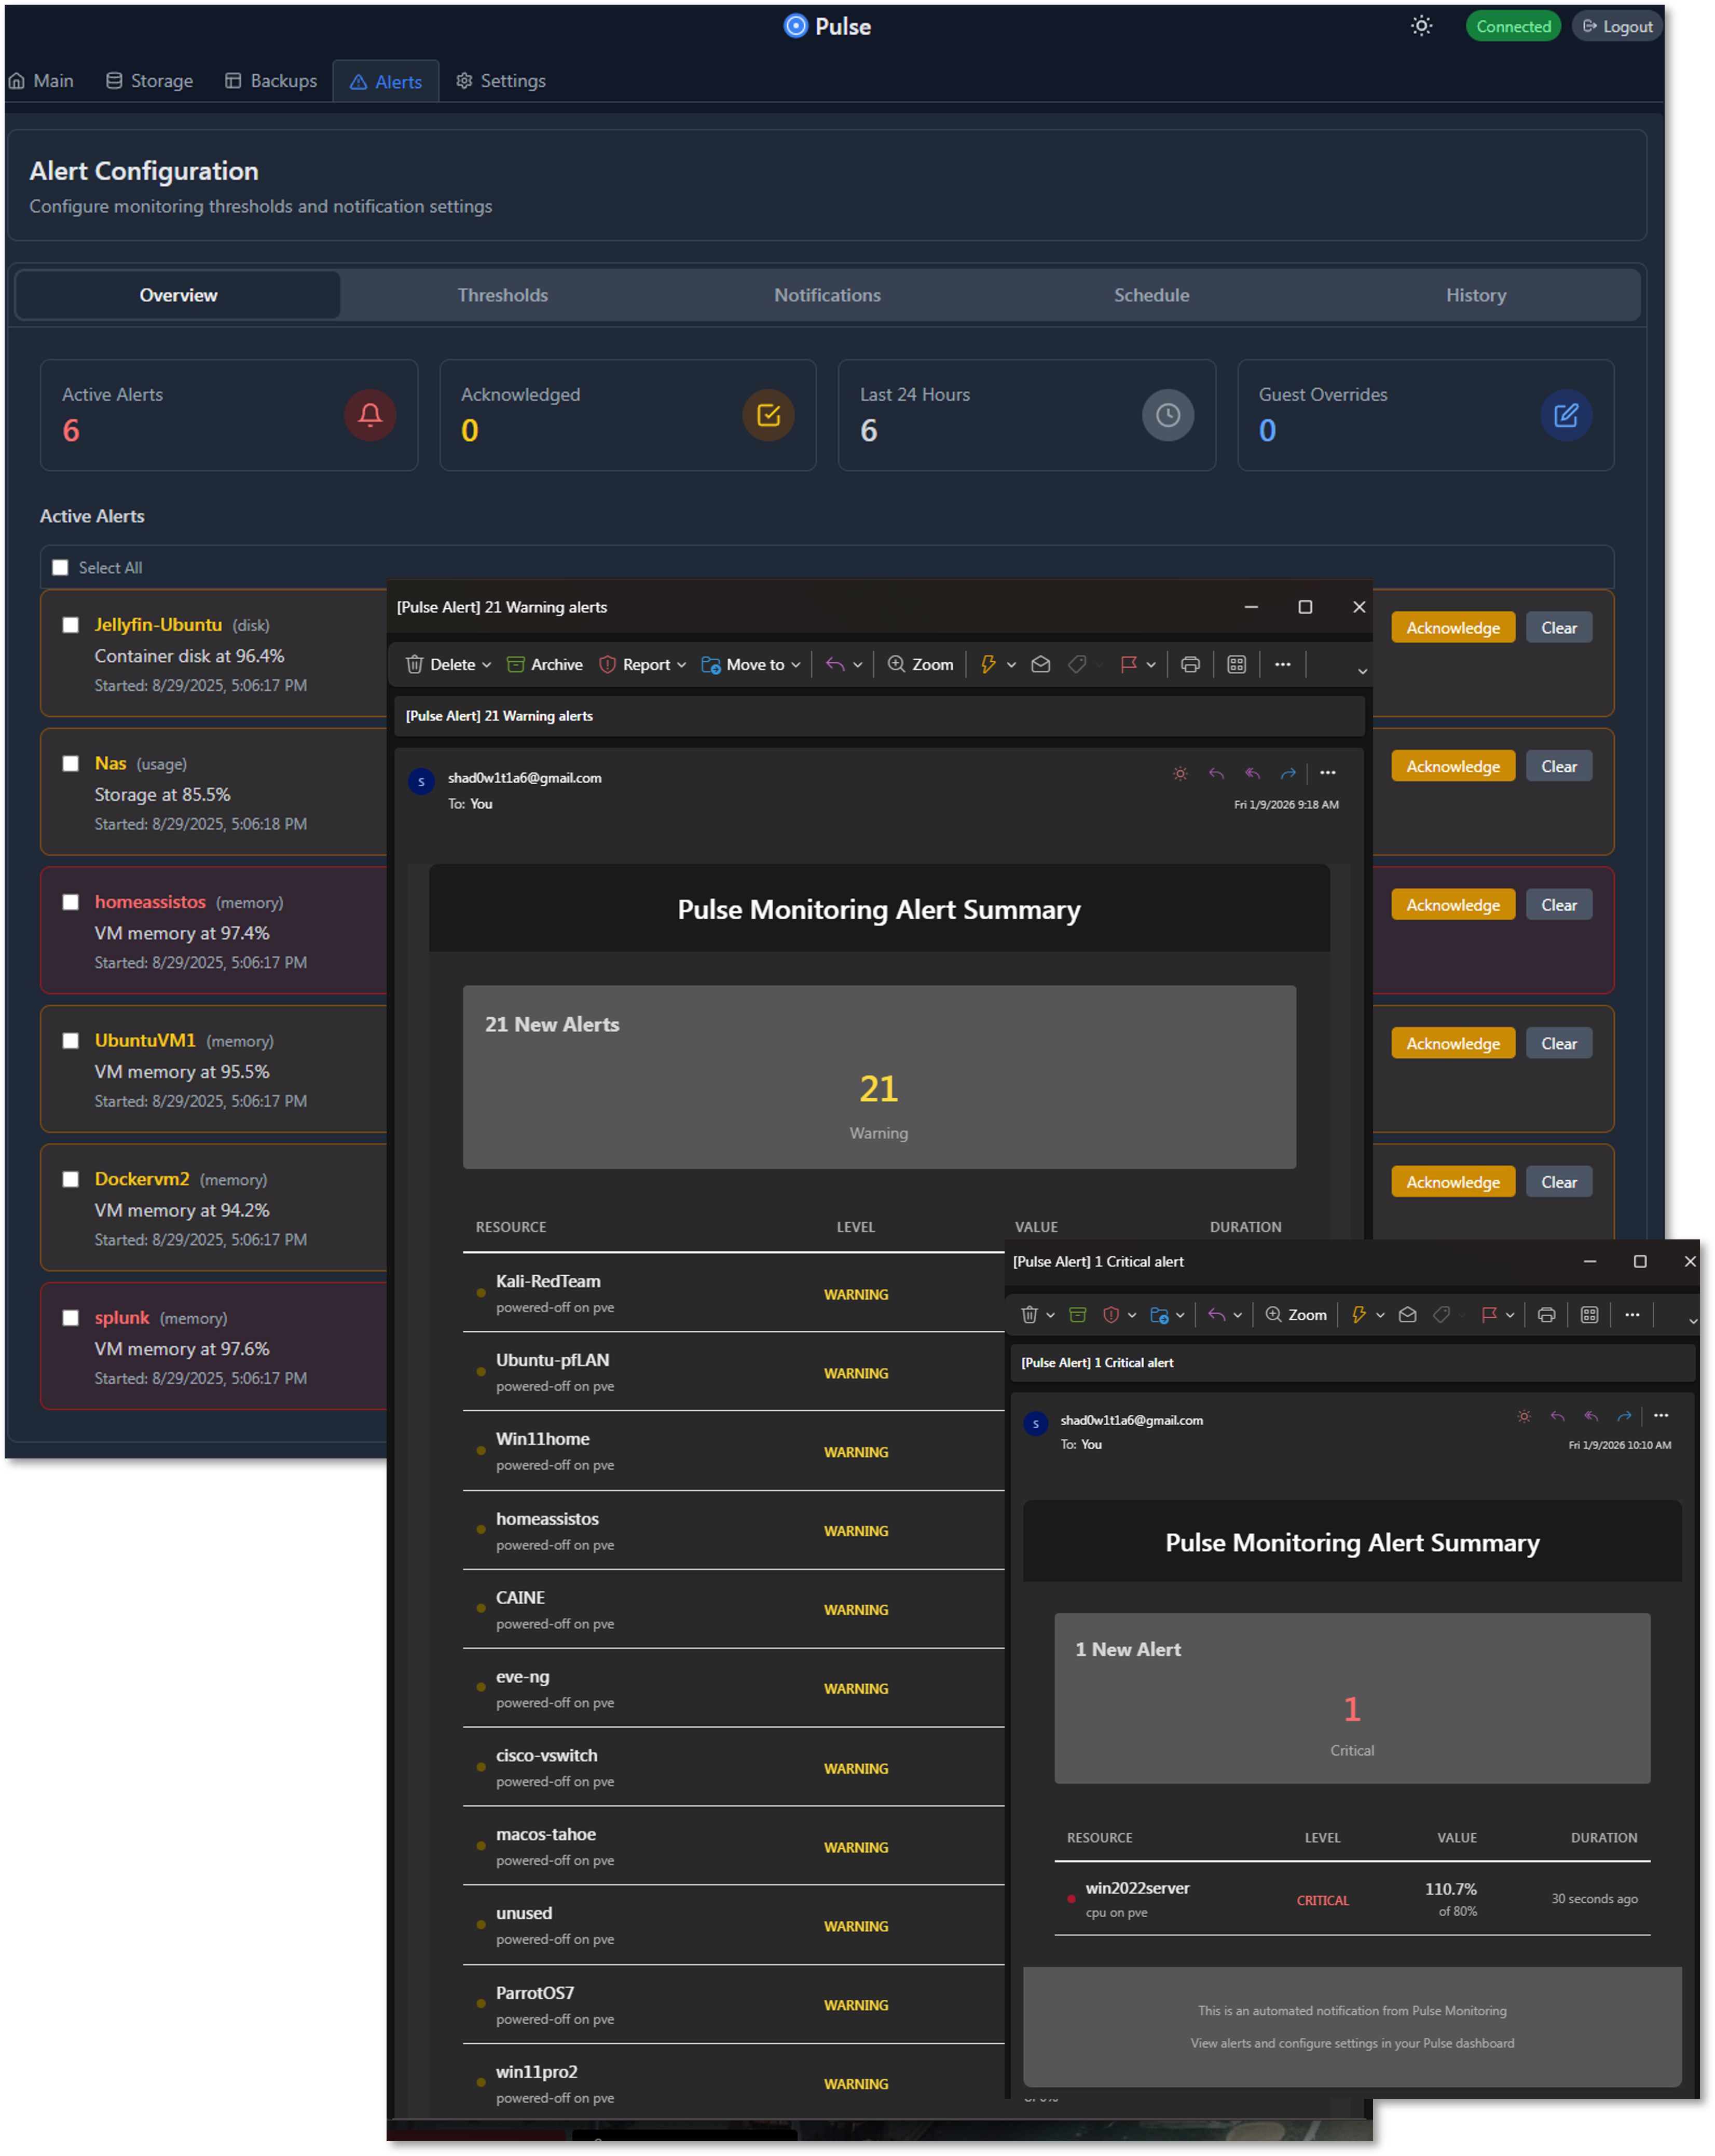
Alert Dashboard and Notifications:
Summary of current alerts, configured thresholds, notifications, schedule and alert history.
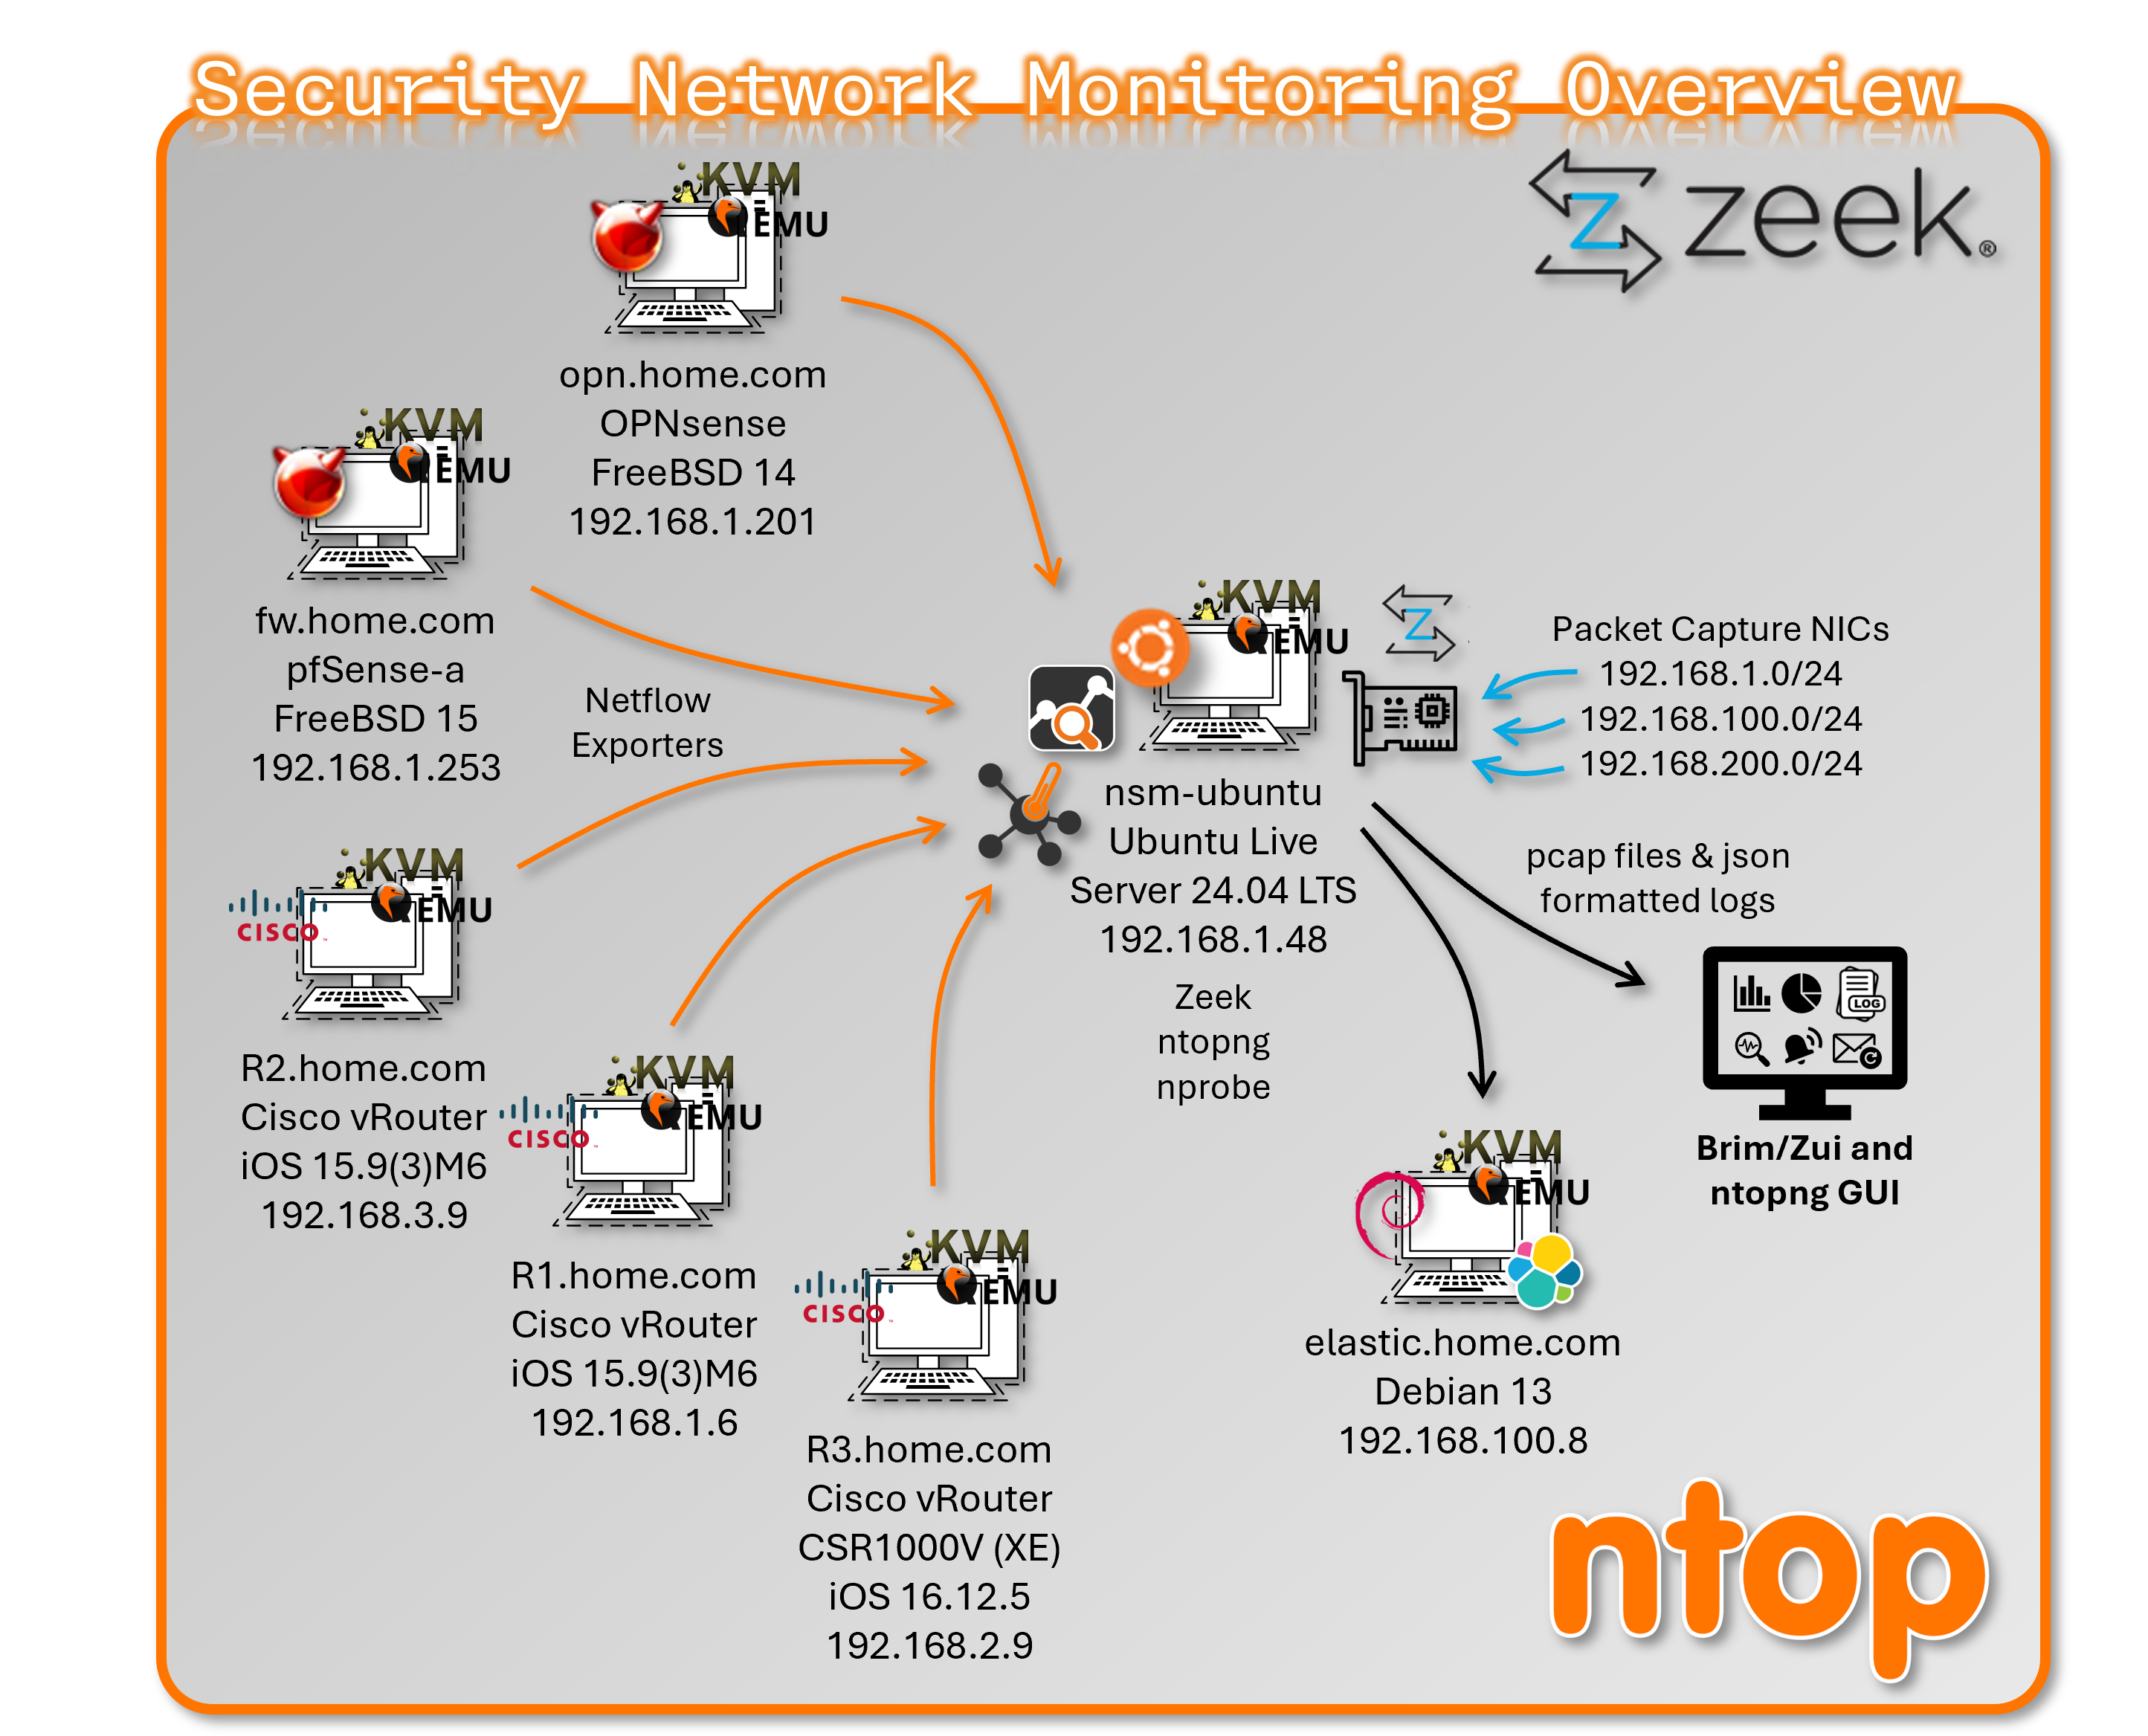
Network Security Monitoring Sensor — Zeek and ntopng
Deployment Overview
The NSM host is a dedicated Ubuntu-based sensor VM running on Proxmox, purpose-built for deep packet inspection, network flow collection, and protocol metadata extraction. It operates as a passive, observe-only node — no traffic is routed through it. Zeek provides full protocol metadata logging across all monitored segments; ntopng provides flow-level visibility via NetFlow v9 ingestion from network firewalls and Cisco devices. Log output feeds both the Elastic stack for long-term retention and Brim/Zui for local forensic analysis.
Security Impact
- Full protocol metadata across all monitored network segments (DNS, HTTP, SSL/TLS, SSH, SMB, RDP, DCE-RPC)
- NetFlow-based east-west and north-south traffic visibility
- File hashing and Notice/Intel/Weird framework detections from Zeek
- Passive-only design eliminates sensor as an attack vector or pivot point
- SOC-grade log output available for correlation, alerting, and forensic review
Deployment Rationale
General infrastructure monitoring tools provide host and service metrics but no network-layer visibility. The NSM host fills this gap with dedicated packet capture and flow analysis capability, mirroring enterprise SOC sensor architectures. Zeek and ntopng together provide both metadata-level detail and flow-level aggregation, enabling detection use cases that SIEM and EDR alone cannot cover.
Architecture Principles Alignment
- Defense in Depth: Network metadata layer complements host-based EDR (Wazuh), IDS/IPS (Suricata/Snort), and firewall logging; detects lateral movement and protocol anomalies not visible at the endpoint
- Secure by Design: Capture NICs are isolated from the management interface; the host never routes or forwards traffic
- Zero Trust: All traffic is treated as potentially malicious; full metadata logging supports continuous verification and retroactive investigation
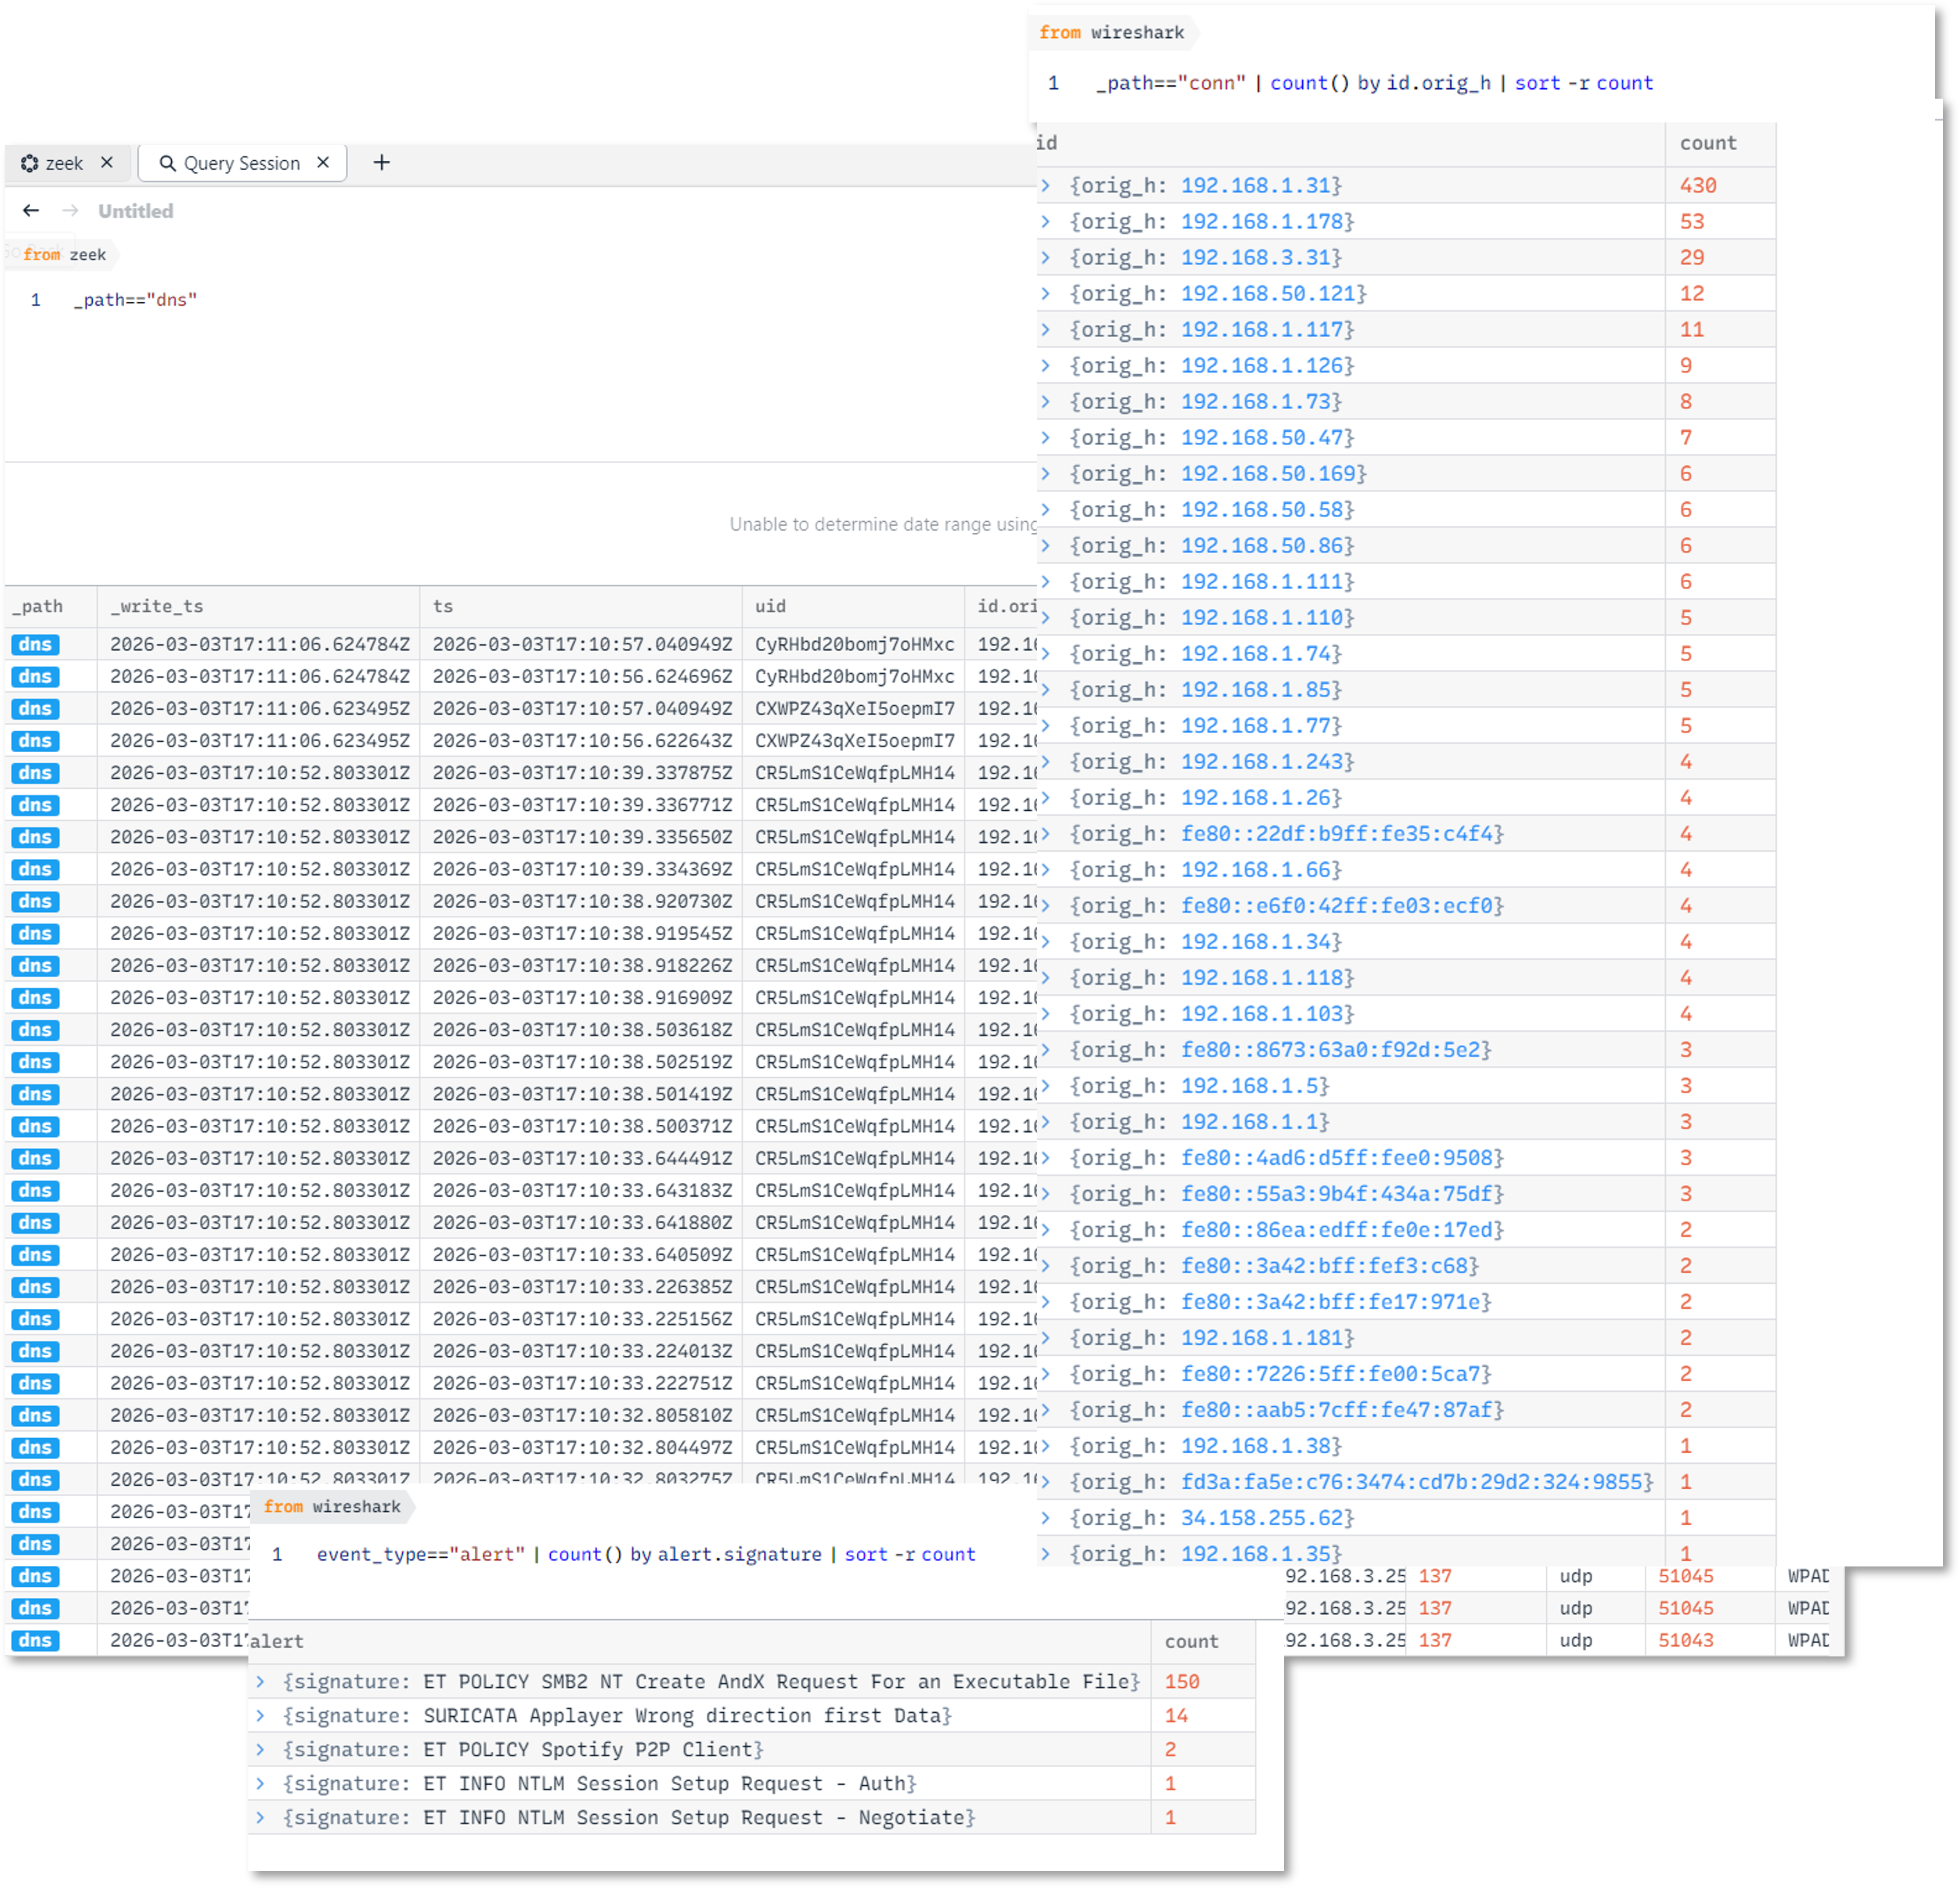
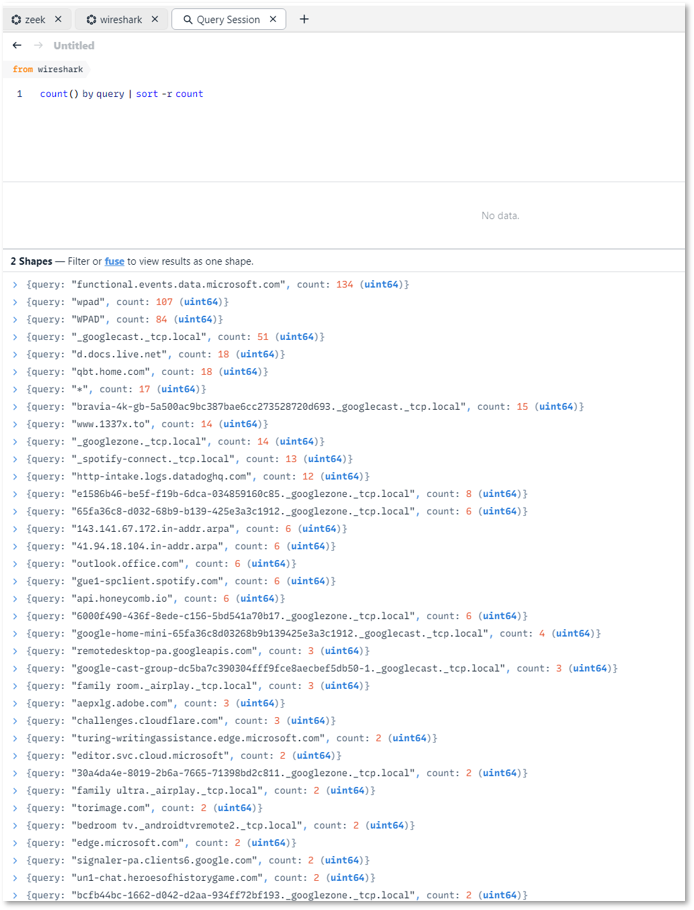
Zeek — Protocol Metadata Engine
Zeek runs in a cluster layout to maximize throughput across three capture interfaces. All log output is JSON-formatted for direct ingestion by Elastic and Brim/Zui.
Cluster Layout
| Role | Host | Interface | AF_PACKET Fanout ID |
|---|---|---|---|
| Manager | localhost | — | — |
| Proxy | localhost | — | — |
| worker-1 | localhost | enp6s19 | 20 |
| worker-2 | localhost | enp6s20 | 21 |
| worker-3 | localhost | enp6s21 | 22 |
Monitored Networks
| Subnet | Label |
|---|---|
| 192.168.1.0/24 | prod_lan |
| 192.168.100.0/24 | lab_lan1 |
| 192.168.200.0/24 | lab_lan2 |
Enabled Frameworks and Analyzers
- Protocol analyzers: DNS, HTTP, SSL/TLS, SSH, SMB, RDP, DCE-RPC
- Notice framework
- Intel framework
- Weird framework
- File hashing
Directory Layout
/opt/monitoring/zeek/
  site/      # local.zeek, JSON logging policy, tuning
  logs/      # timestamped logs + current/ symlink
  spool/     # cluster runtime state
Configuration — node.cfg
[zeek]
Type=manager
host=localhost

[proxy]
type=proxy
host=localhost

[worker-1]
type=worker
host=localhost
interface=enp6s19
lb_method=af_packet
lb_procs=1
af_packet_fanout_id=20

[worker-2]
type=worker
host=localhost
interface=enp6s20
lb_method=af_packet
lb_procs=1
af_packet_fanout_id=21

[worker-3]
type=worker
host=localhost
interface=enp6s21
lb_method=af_packet
lb_procs=1
af_packet_fanout_id=22
Configuration — networks.cfg
192.168.1.0/24     prod_lan
192.168.100.0/24   lab_lan1
192.168.200.0/24   lab_lan2
Configuration — local.zeek (relevant additions)
@load policy/tuning/json-logs
@load json-streaming-logs

redef JSONStreaming::disable_default_logs = T;
redef LogAscii::json_timestamps = JSON::TS_ISO8601;
Sample Output — conn.log (JSON)
{
  "_path": "conn",
  "_write_ts": "2026-03-03T16:26:18.414917Z",
  "ts": "2026-03-03T16:25:48.414242Z",
  "uid": "C2eBK5DVFxx8BBe81",
  "id.orig_h": "192.168.3.31",
  "id.orig_p": 137,
  "id.resp_h": "192.168.3.255",
  "id.resp_p": 137,
  "proto": "udp",
  "service": "dns",
  "duration": 13.967844,
  "orig_bytes": 450,
  "resp_bytes": 0,
  "conn_state": "S0",
  "local_orig": true,
  "local_resp": true,
  "missed_bytes": 0,
  "history": "D",
  "orig_pkts": 9,
  "orig_ip_bytes": 702,
  "resp_pkts": 0,
  "resp_ip_bytes": 0,
  "ip_proto": 17
}
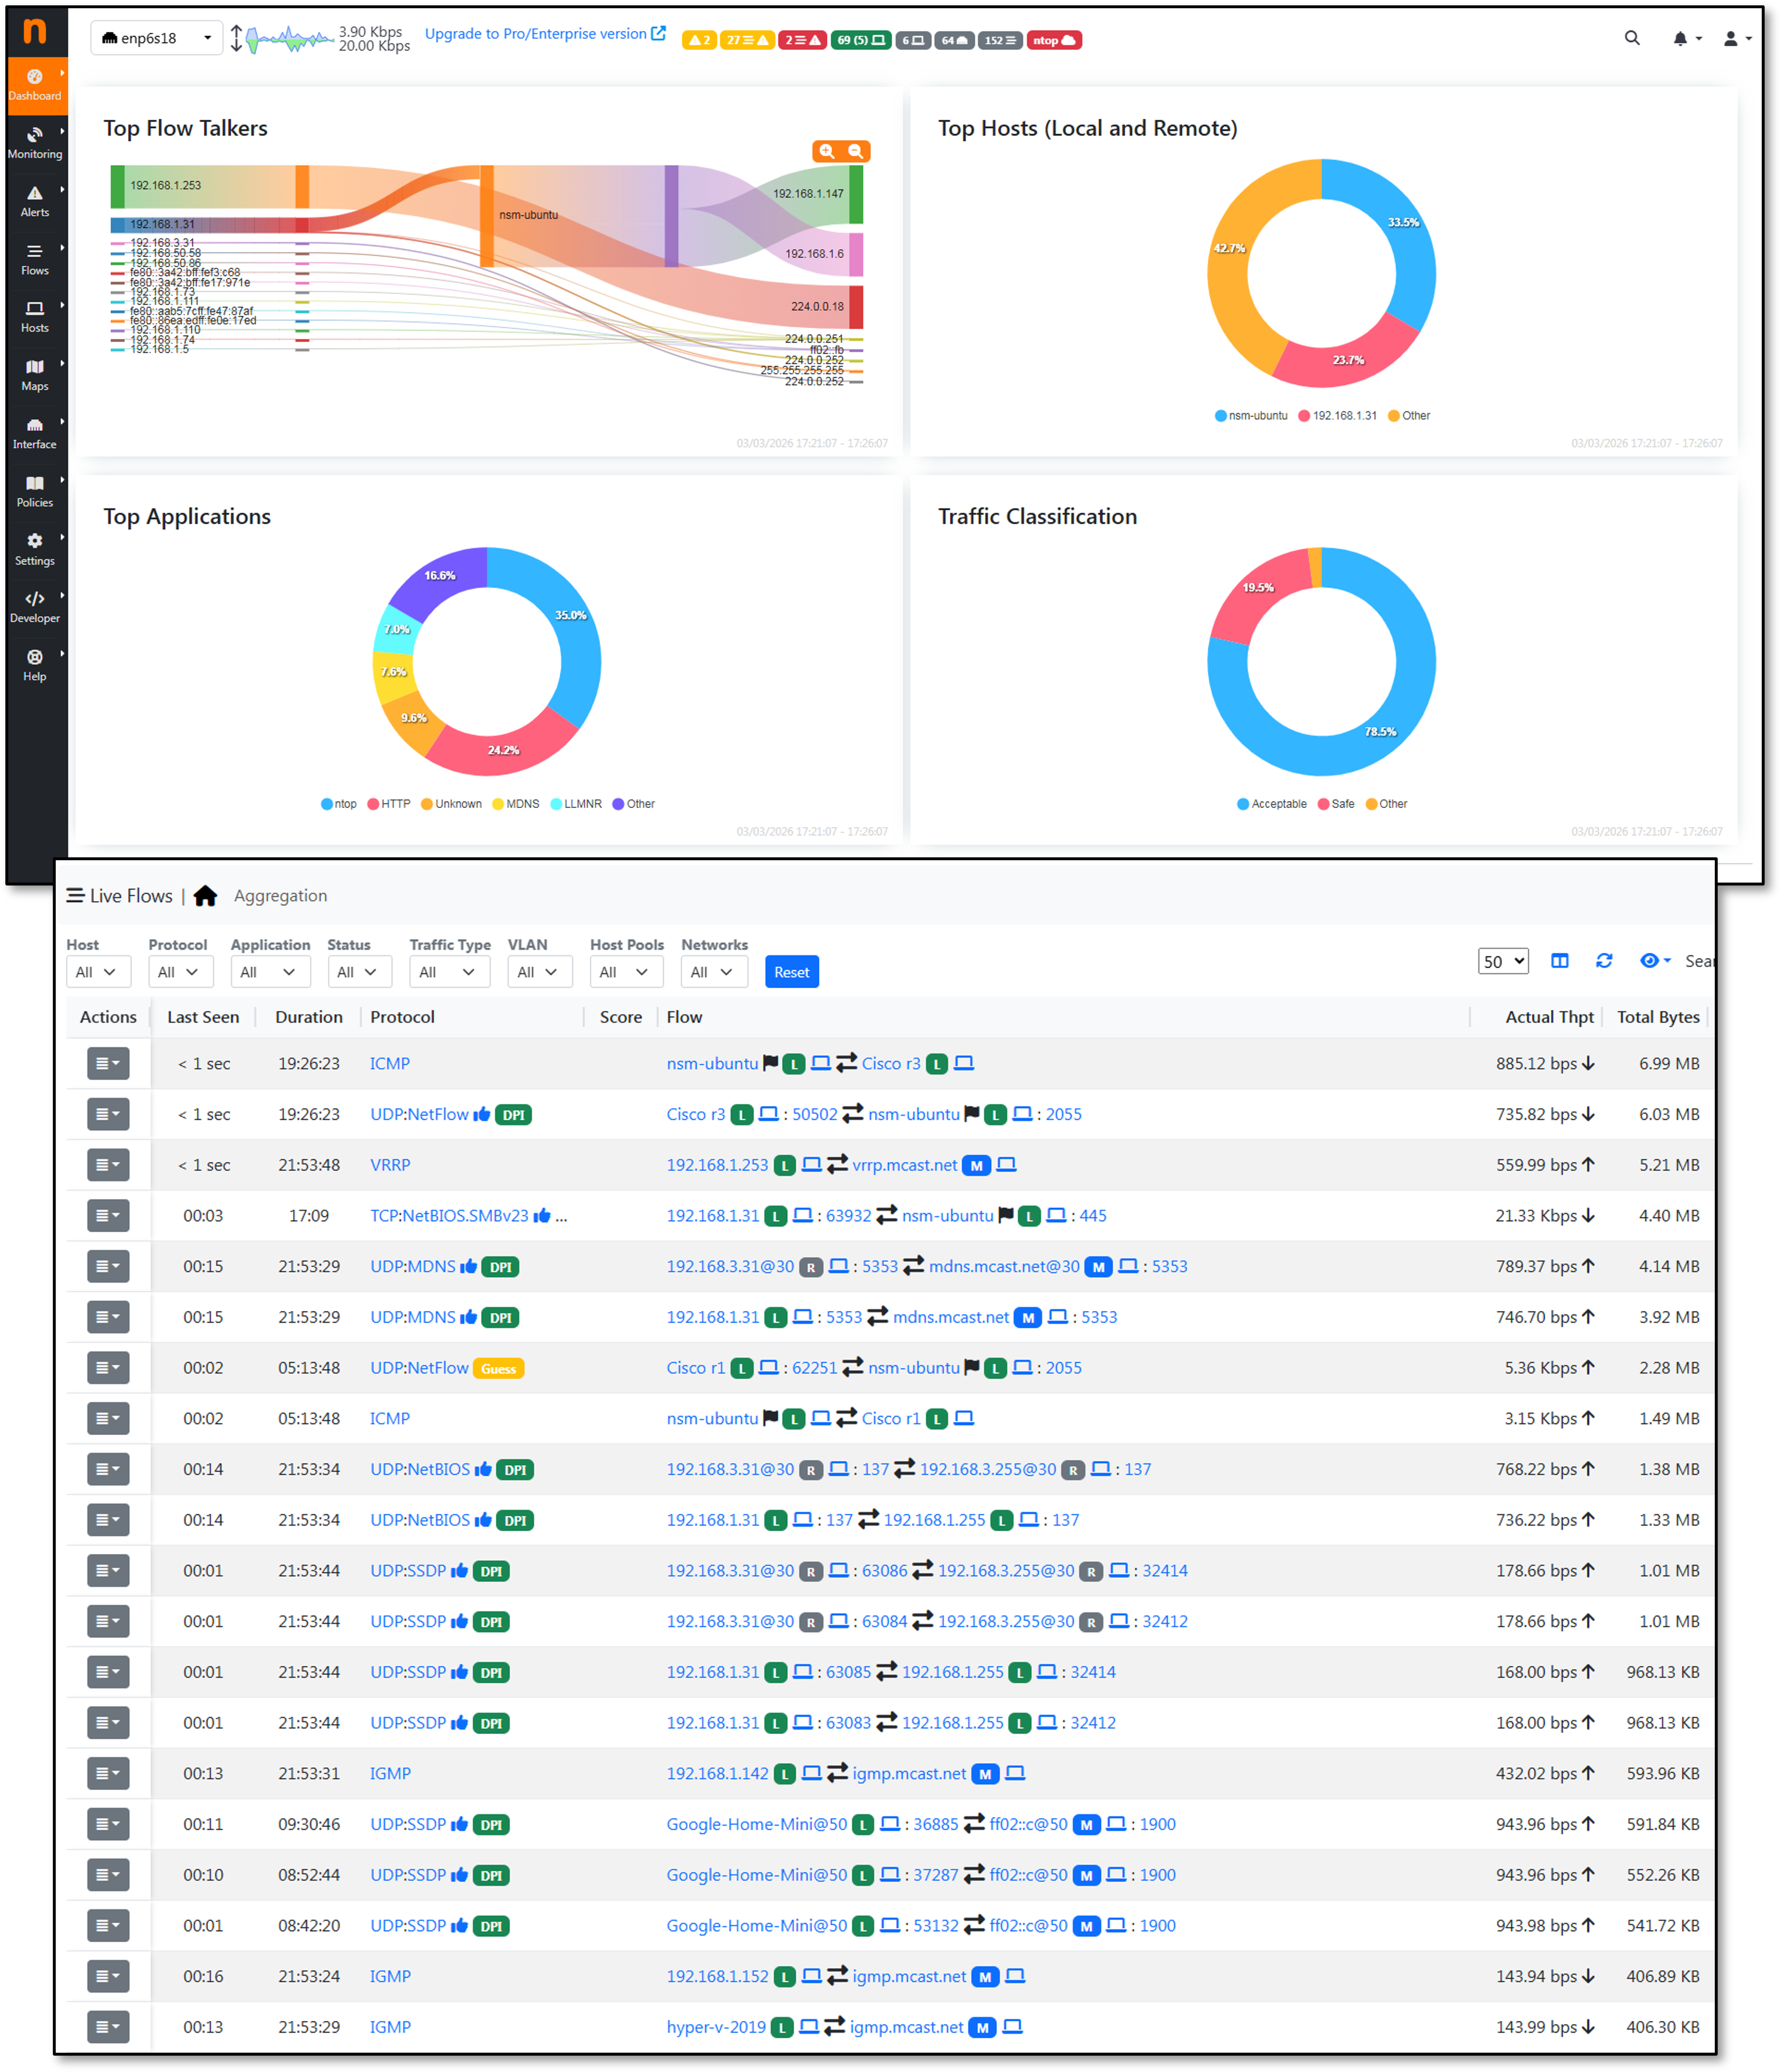
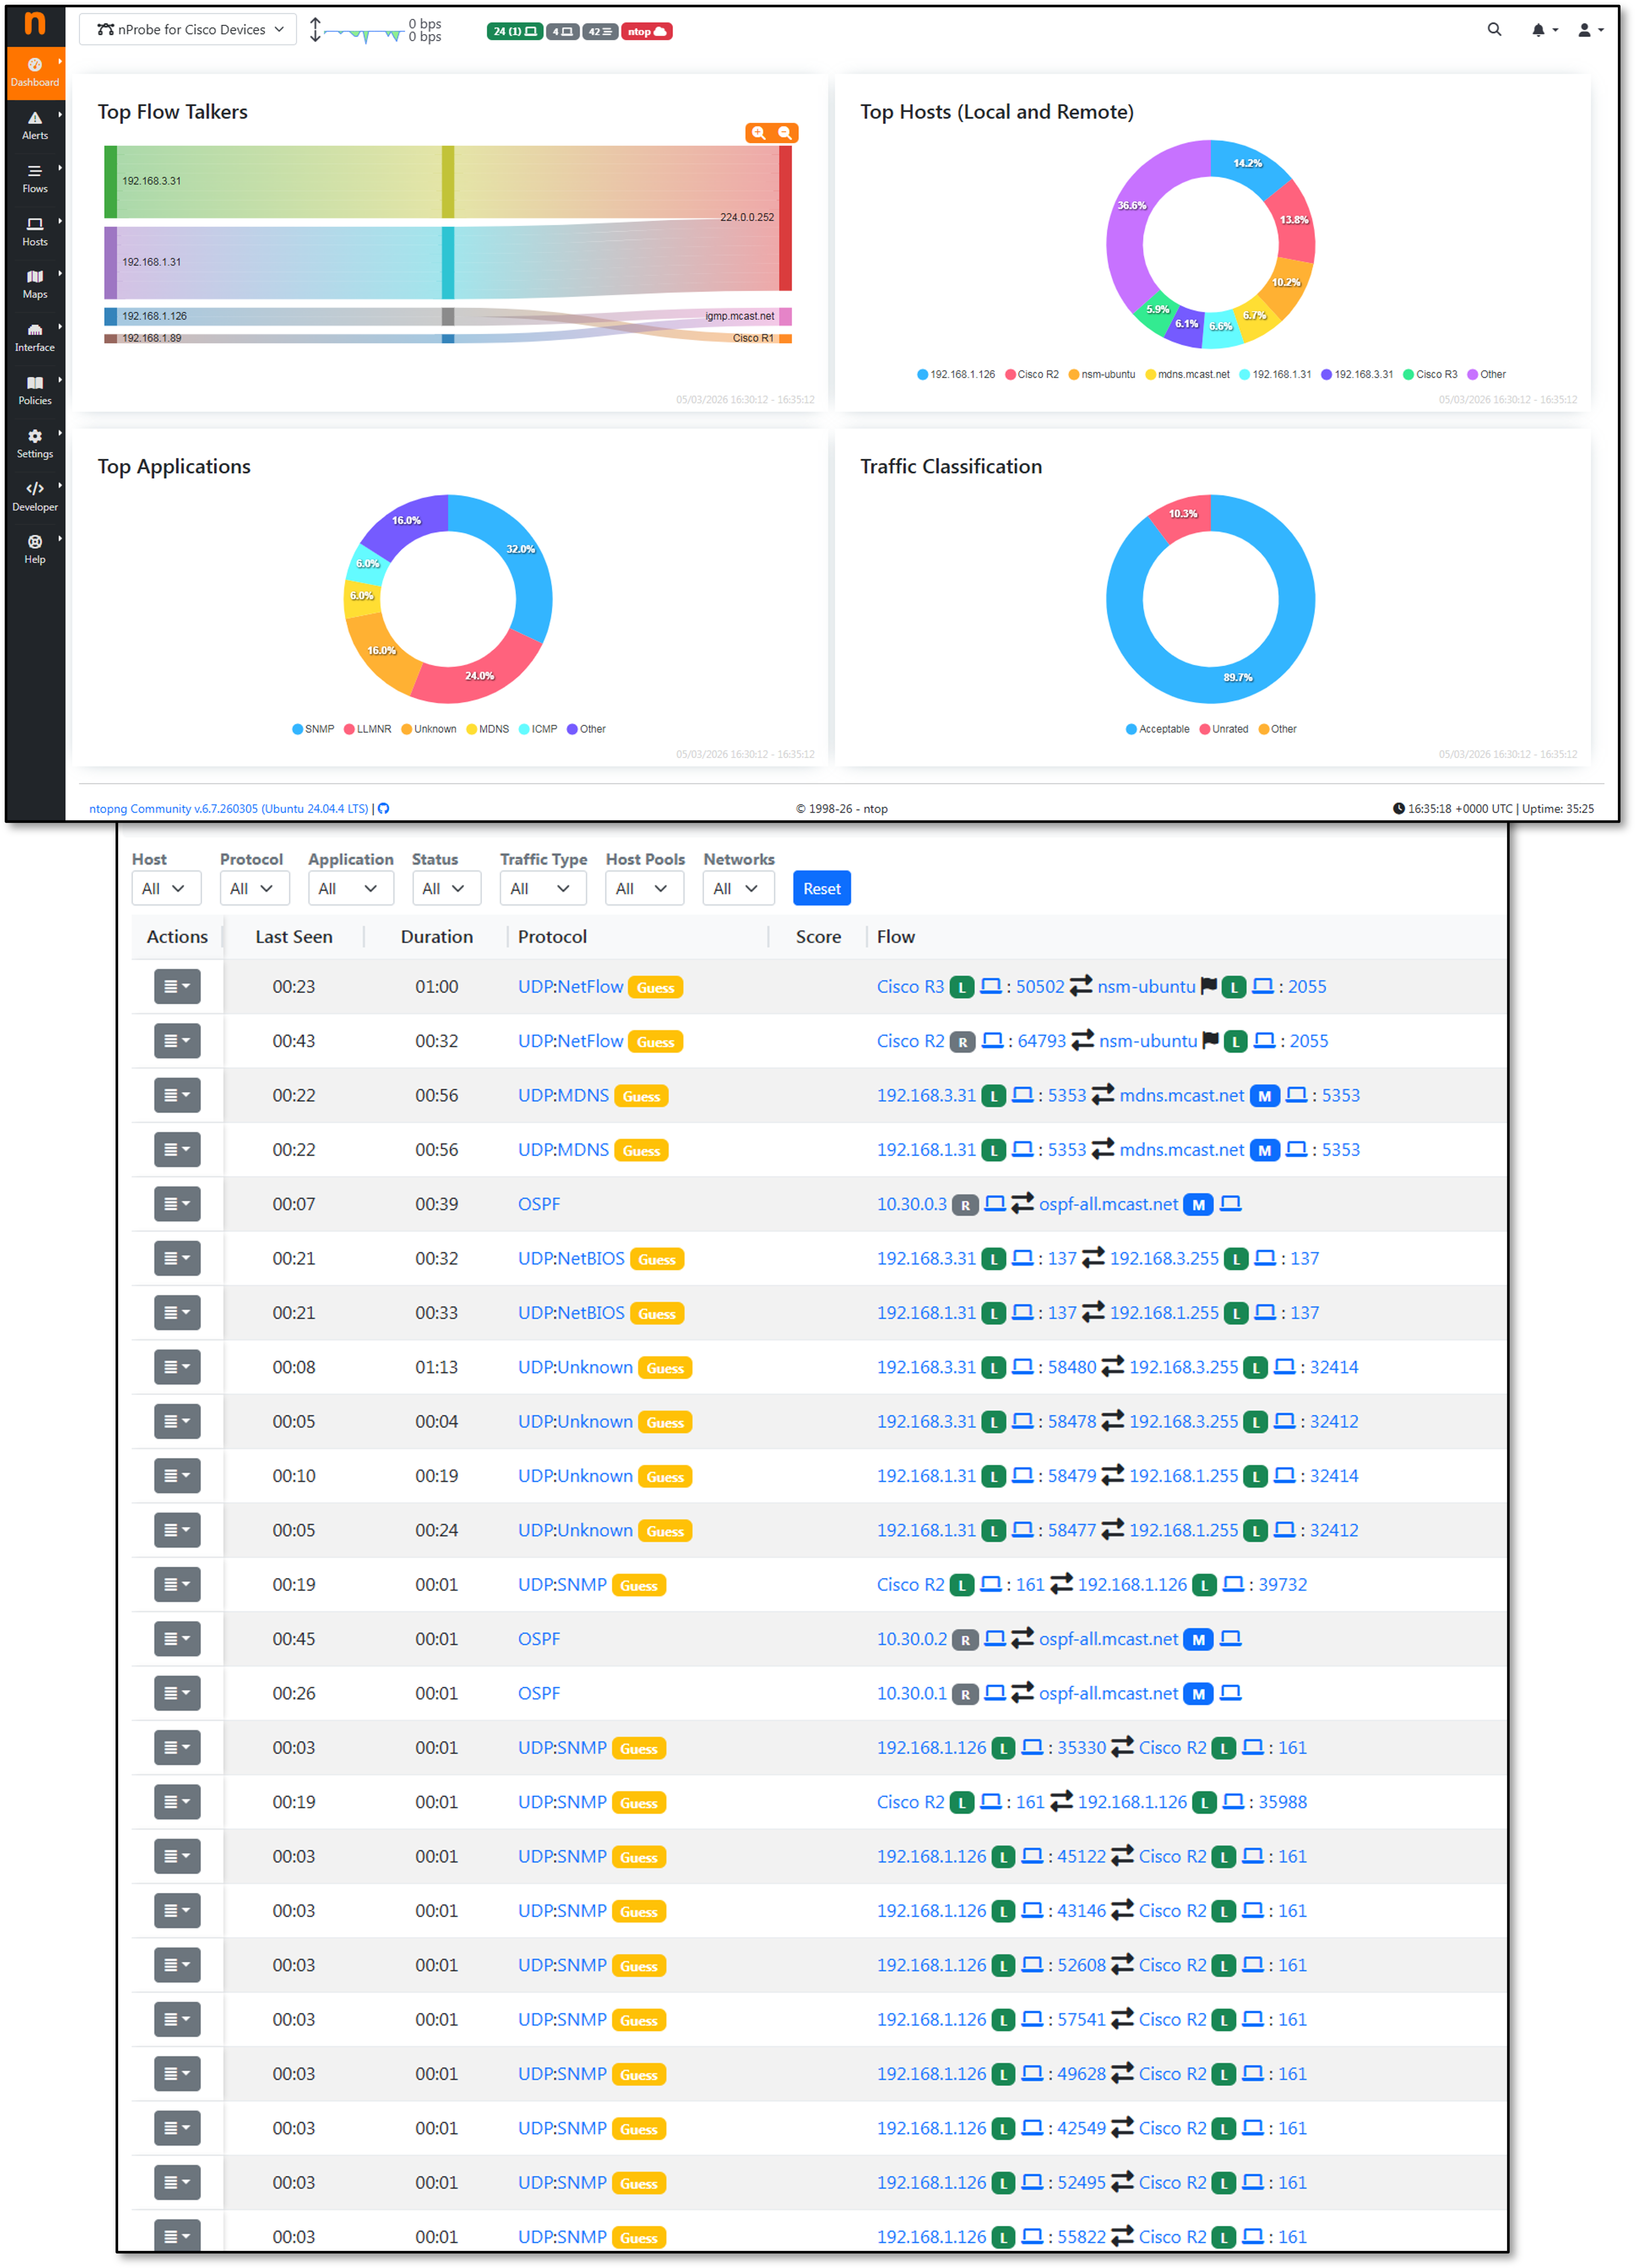
ntopng — Flow Visibility
ntopng ingests NetFlow v9 exports from pfSense, OPNsense, and Cisco infrastructure (r1, r2, r3) and provides real-time and historical flow analysis via a web UI. It complements Zeek's per-connection metadata with aggregated flow-level visibility across the network.
Two nProbe instances are configured to avoid the community edition limitation of 5,000 flows. nProbe1 collects live flows from Cisco devices; nProbe2 collects from the firewalls.
Configuration — ntopng.conf
--http-port=3000
--local-networks="192.168.3.0/24,192.168.100.0/24,192.168.200.0/24"
--data-dir=/opt/monitoring/ntopng/data
--community
-i=tcp://127.0.0.1:5556
-i=tcp://127.0.0.1:5557
-i=enp6s18
-i=enp6s19
-i=enp6s20
-i=enp6s21
Configuration — nprobe.conf (Cisco devices)
--ntopng=zmq://127.0.0.1:5556
--collector-port=2055
-n=none
-i=none
-T="@NTOPNG@"
--lifetime-timeout 60
--idle-timeout 15
Configuration — nprobe-firewalls.conf
--ntopng=zmq://127.0.0.1:5557
--collector-port=2056
-n=none
-i=none
-T="@NTOPNG@"
--lifetime-timeout 60
--idle-timeout 15
NetFlow Export — Cisco Configuration
Cisco vIOS routers export Flexible NetFlow v9 to the NSM host at 192.168.1.48 UDP/2055. Source is a stable SVI or loopback interface; active/inactive timeouts are tuned for the ntopng collector.
flow record ntop-record
 description NetFlow record for ntopng
 match ipv4 source address
 match ipv4 destination address
 match transport source-port
 match transport destination-port
 match interface input
 match interface output
 match ipv4 tos
 match flow direction
 match ipv4 protocol
 collect counter bytes long
 collect counter packets long
 collect timestamp sys-uptime first
 collect timestamp sys-uptime last

flow exporter ntop-exporter
 description Export to ntopng
 destination 192.168.1.48
 source Loopback1
 transport udp 2055
 template data timeout 60

flow monitor ntop-monitor
 description Monitor for ntopng
 exporter ntop-exporter
 cache timeout active 60
 record ntop-record

interface GigabitEthernet0/1-3
 ip flow monitor ntop-monitor input
 ip flow monitor ntop-monitor output
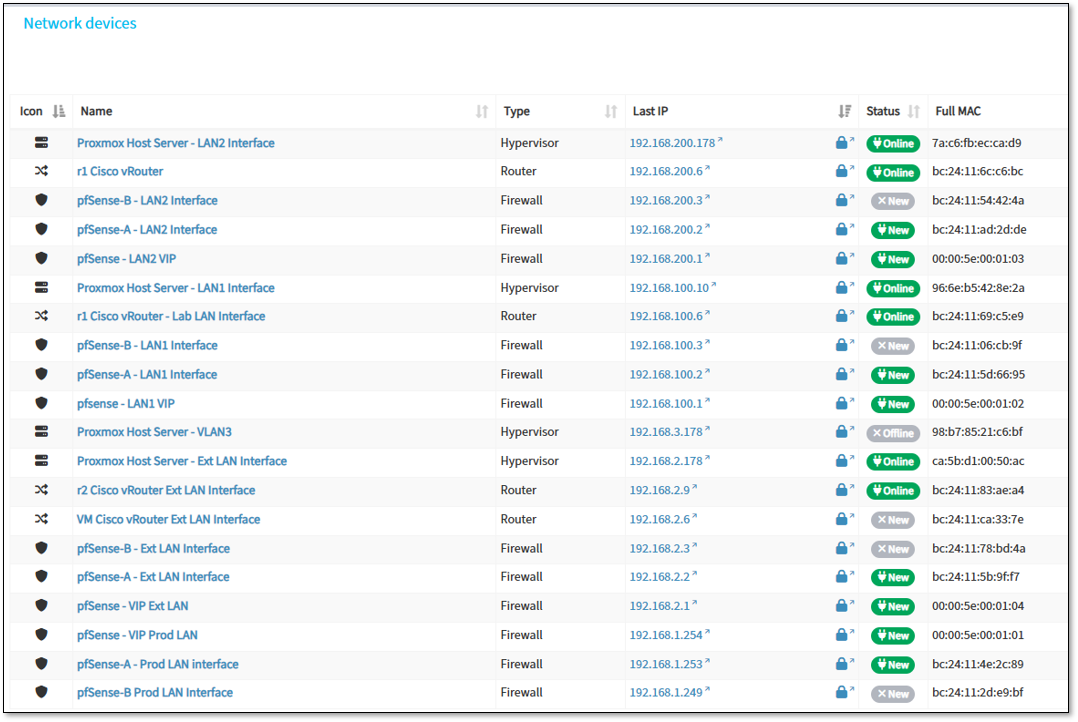
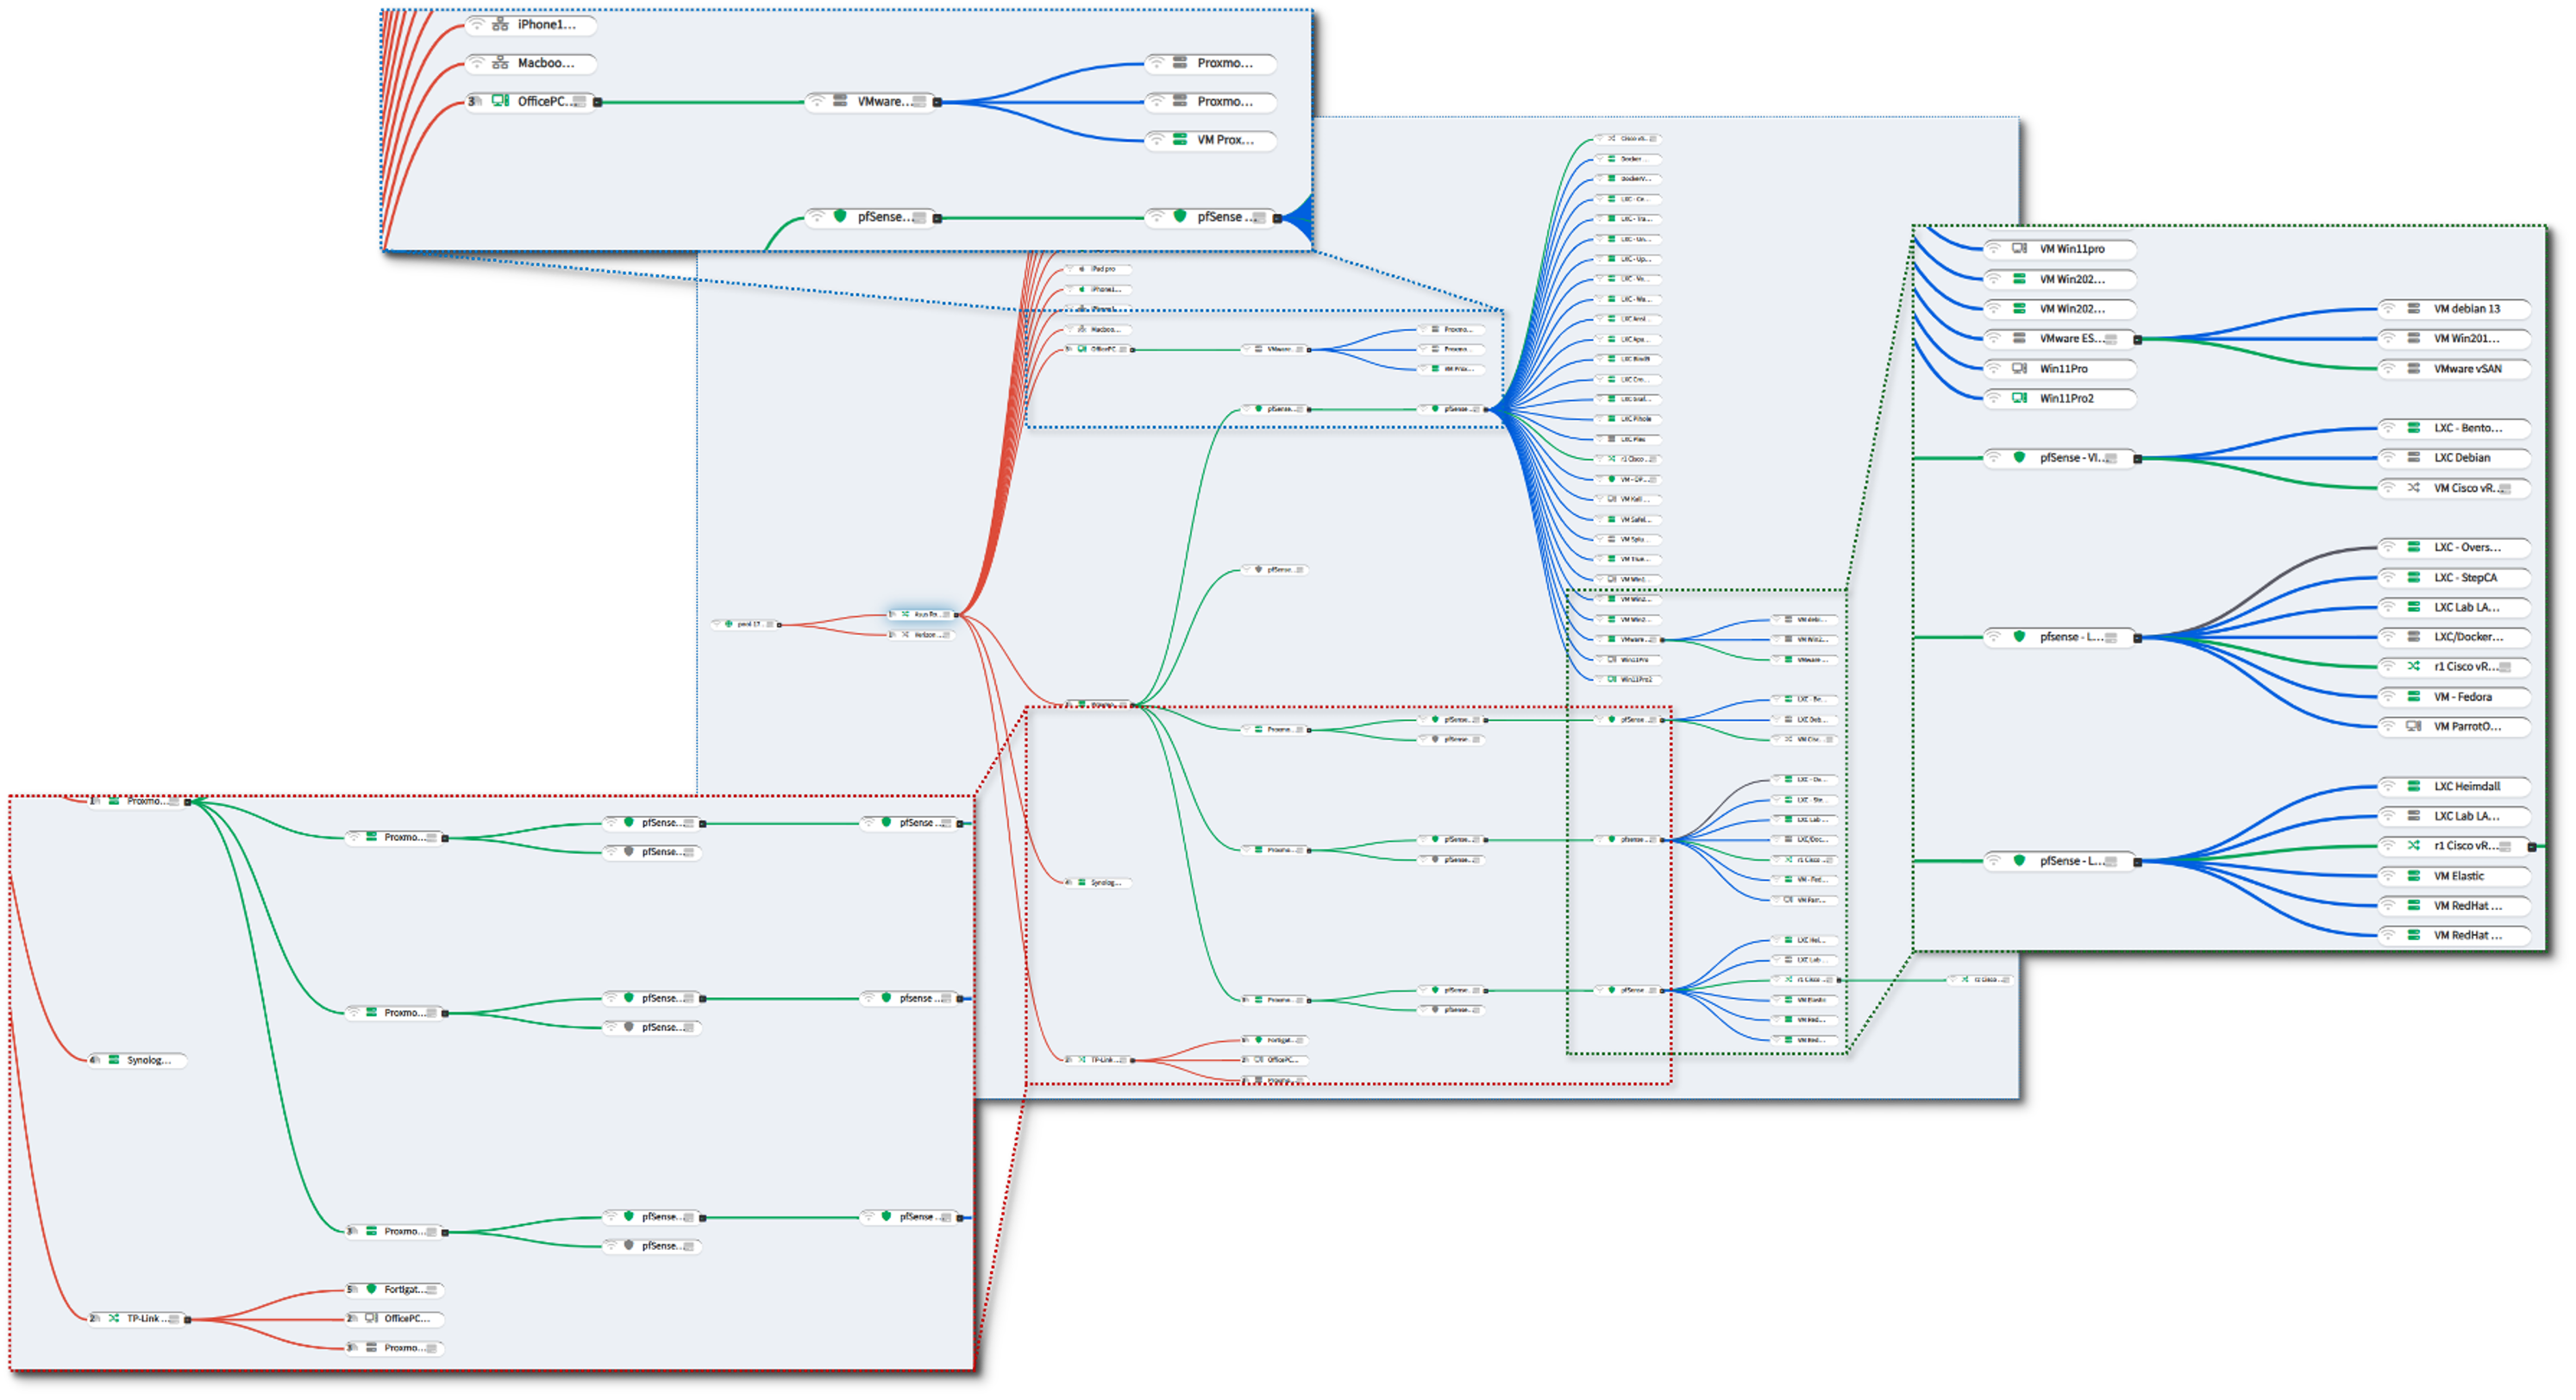
NetAlertX - Network Visibility & Asset Intelligence Framework
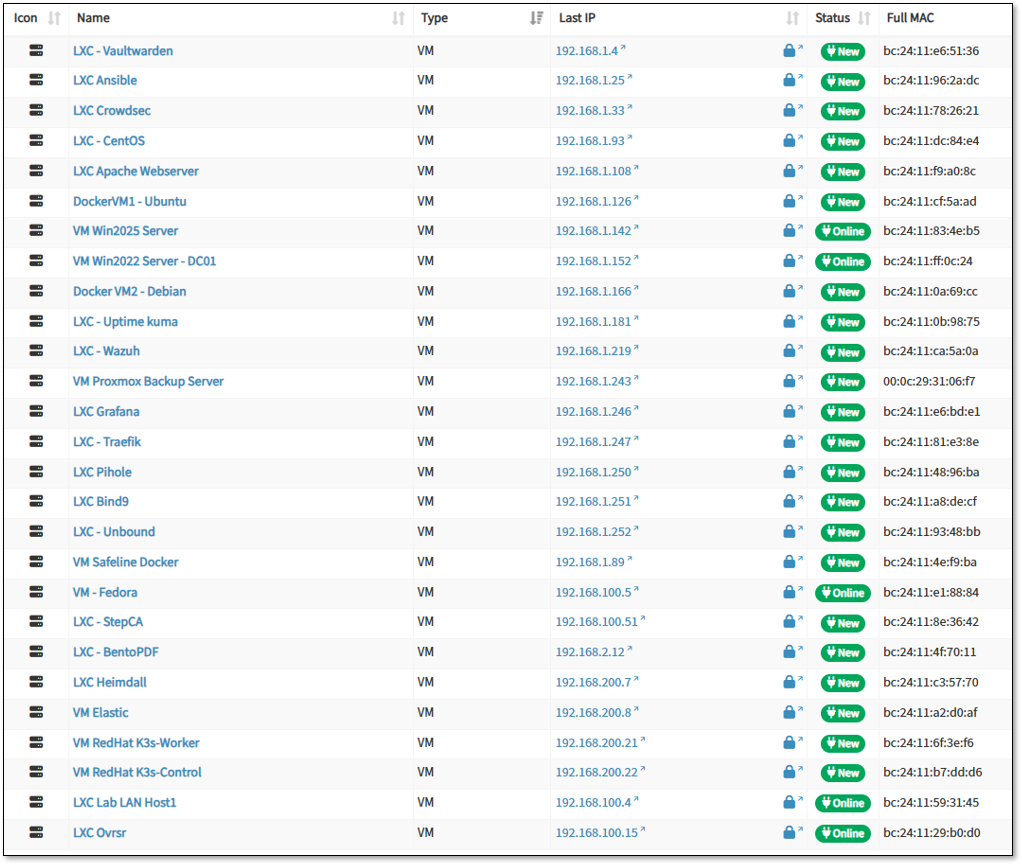
Deployment Overview
NetAlertX operates as a nested Docker container on a LXC host using host networking mode for comprehensive network discovery. The deployment provides continuous asset inventory, device profiling, and network topology mapping across production and lab segments (Prod_LAN, Lab_LAN1, Lab_LAN2, Ext_LAN).
The container leverages multiple NIC interfaces on the host for passive and active scanning while maintaining isolation from sensitive ISO_LAN segments.
Security Impact
- Real-time asset visibility identifies rogue devices and unauthorized network connections
- Automated device profiling detects configuration drift and shadow IT deployments
- Network topology mapping reveals unexpected lateral movement paths
- MAC address tracking correlates device identity across DHCP lease changes
- Alert generation on new device detection enables rapid security response
Deployment Rationale
Enterprise SOCs require accurate asset inventories for vulnerability management, incident response, and compliance reporting. NetAlertX provides continuous discovery without agent deployment, identifying IoT devices, network appliances, and ephemeral containers that evade traditional endpoint management.
Architecture Principles Alignment
Defense in Depth: Asset visibility layer complements firewall ACLs and IDS/IPS by identifying security gaps in network segmentation
Secure by Design: Passive discovery minimizes network impact; isolated from sensitive subnets to prevent reconnaissance against high-value targets
Zero Trust: Continuous device enumeration validates network access aligns with authorized asset inventory; detects policy violations
High-Level Configuration
- Deployment Model: Docker container with host networking (--network host)
- Discovery Methods: ARP scanning, DHCP lease monitoring, mDNS/SSDP enumeration, SNMP polling
- Monitored Networks: 192.168.1.0/24 (Prod_LAN), 192.168.100.0/24 (Lab_LAN1), 192.168.200.0/24 (Lab_LAN2), 192.168.2.0/24 (Ext_LAN)
- Exclusions: 10.20.0.0/24 and 192.168.3.0/24 (ISO_LAN segments) - intentionally excluded from scanning
- Alert Triggers: New device detection, unknown MAC addresses, duplicate IP assignments, offline device recovery
- Integration: Webhook notifications to SOC alerting pipeline; asset data exported for vulnerability correlation
Alerting and Notification Architecture
Deployment Overview
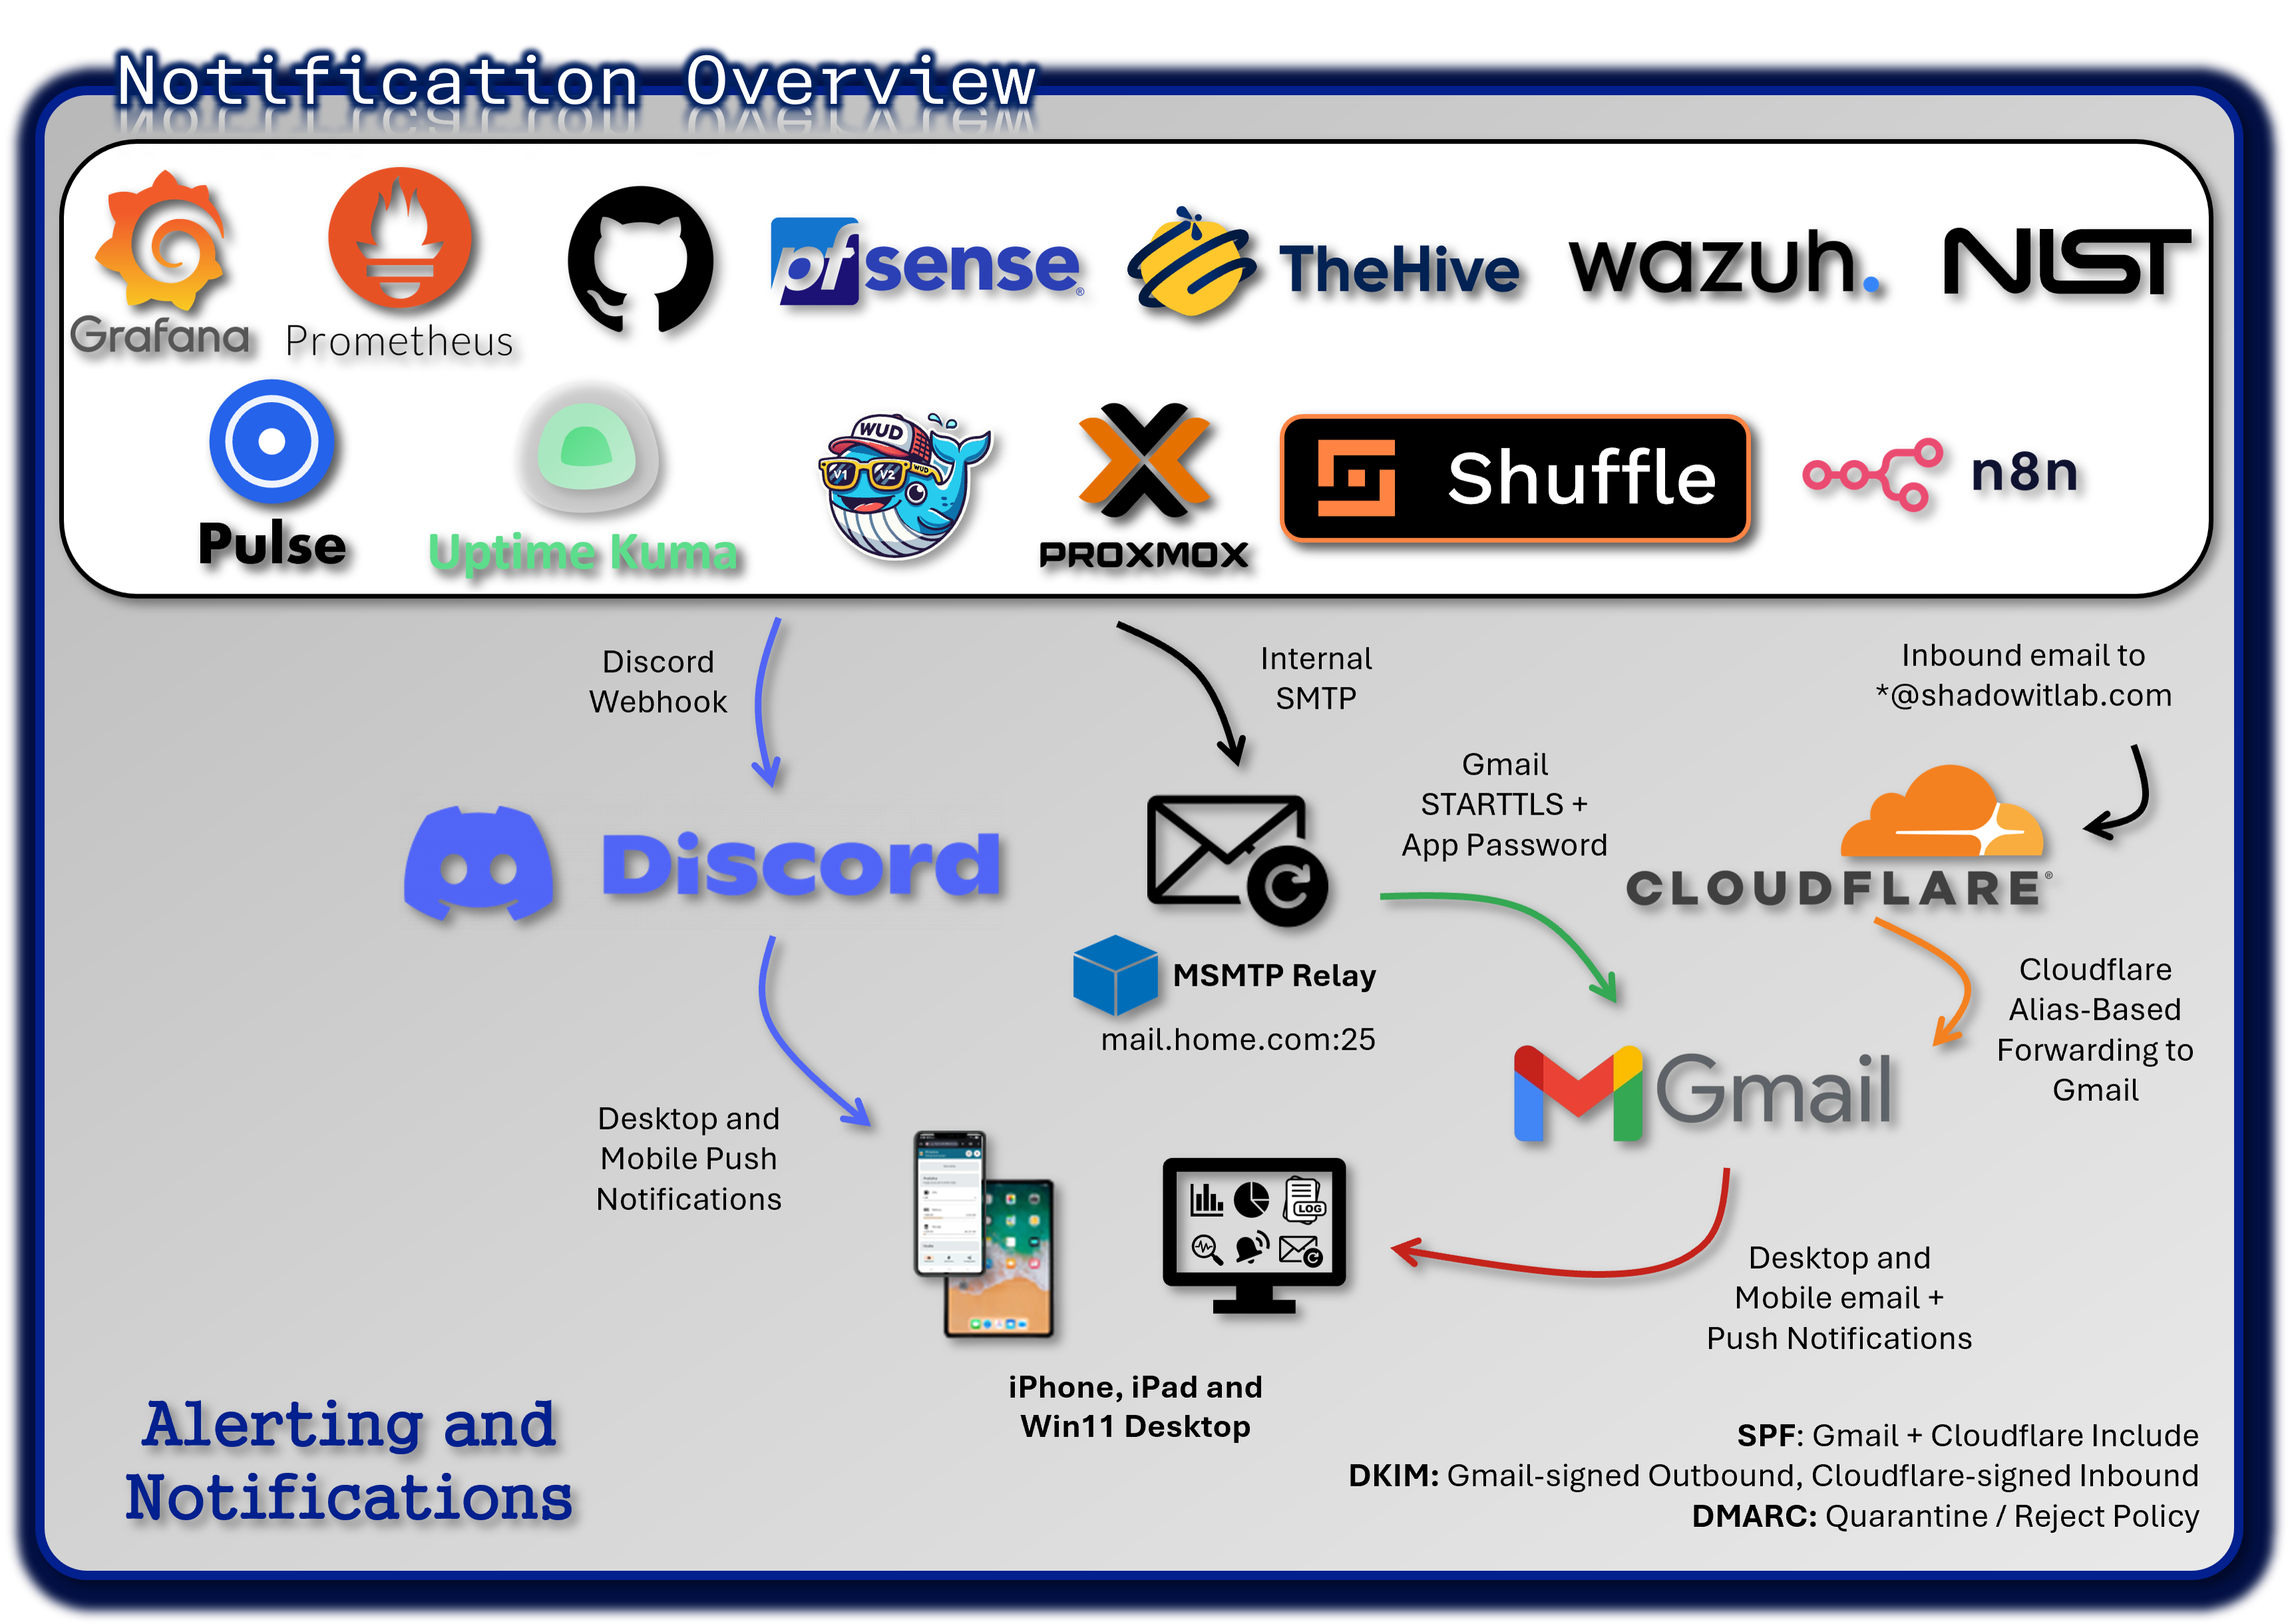
The alerting architecture ensures real-time visibility into operational and security events across the entire lab environment. Alerts from monitoring tools, SIEM platforms, EDR agents, and infrastructure services are routed through multiple redundant channels (Discord, SMTP relay, and Cloudflare email routing). This multi-path design ensures no critical alert is ever missed and enables granular triage through dedicated service-specific channels.
Security Impact
- Immediate notification of outages, anomalies, or security events
- Redundant channels prevent alert loss due to single-system failure
- Segmented channels reduce noise and improve triage efficiency
Deployment Rationale
Modern SOC/NOC operations rely on multi-channel alerting to ensure rapid response. This architecture demonstrates proficiency with webhook-based alerting, SMTP relays, email routing, and real-time collaboration platforms.
Architecture Principles Alignment
Defense in Depth: Multiple alerting paths ensure resilience
Secure by Design: TLS-encrypted SMTP; restricted webhook endpoints
Zero Trust: Alerts validated and routed per-service; no implicit trust in any channel
Discord Private Server - Centralized Notification Hub
A private Discord server acts as the real-time alerting hub for the entire environment. Each monitored service has its own dedicated channel, enabling noise isolation, targeted triage, and clear operational separation.
Security Impact:
- Instant visibility into outages, anomalies, and security alerts
- Channel segmentation prevents alert overload
- Provides audit trails for incident response
Deployment Rationale:
Discord offers low-latency notifications, webhook integration, and structured channel organization—mirroring enterprise chat-ops workflows.
Architecture Principles Alignment:
Defense in Depth: Secondary alerting path alongside email
Secure by Design: Private server; restricted webhook tokens
Zero Trust: No alert is trusted without validation; all events logged
Notification Flow:
[Monitoring Source] → [Alert Trigger] → [Webhook or Script] → [Discord Channel] → [Push Notification]
- Monitoring tools detect anomalies or threshold breaches
- Alerts are triggered via native webhook integrations or custom scripts
- Messages are sent to service-specific Discord channels using Discord's webhook API
- Discord's push notification system delivers alerts to:
- Windows 11 desktop app
- iPad and iPhone mobile apps
Discord Channel Structure:
| Channel Name | Source Tool | Alert Type |
|---|---|---|
| #proxmox | Proxmox VE | Node status, backup failures |
| #grafana | Grafana | Dashboard alerts, data source issues |
| #splunk | Splunk | Security events, log anomalies |
| #wazuh | Wazuh | Host-based intrusion alerts |
| #pulse | Pulse | OpenSearch monitor triggers |
| #uptime-kuma | Uptime Kuma | Service downtime, latency spikes |
| #openvas | OpenVAS | Vulnerability scan results |
| #pfsense | pfSense | Firewall events, VPN status |
| #prometheus | Prometheus | Node exporter, resource thresholds |
| #authentik | Authentik | Auth flow errors/alarms, auth failures |
| #windowsupdates | Windows VMs | Python script completion |
SMTP Relay - Gmail-Backed Email Alerting
Gmail relay to dedicated email address, shad0w1t1a6@gmail.com.
An msmtp container provides a secure SMTP relay to Gmail using STARTTLS and application-specific passwords. Internal services send alerts via standard SMTP on port 25, and msmtp handles encrypted delivery to the dedicated alert mailbox.
Configured Services:
Proxmox, pfSense, OPNsense, TheHive, Uptime Kuma, Wazuh, Grafana, n8n, Synology NAS
Security Impact:
- Provides a reliable, encrypted alerting channel
- Ensures alerts are preserved even if chat-ops channels fail
- Supports forensic review through email retention
Deployment Rationale:
Email remains a universal, durable alerting mechanism. This relay demonstrates secure outbound email configuration and multi-service integration.
Architecture Principles Alignment:
Defense in Depth: Email complements Discord for redundancy
Secure by Design: STARTTLS encryption; app-password authentication
Zero Trust: All alerts validated and logged; no implicit trust in sender
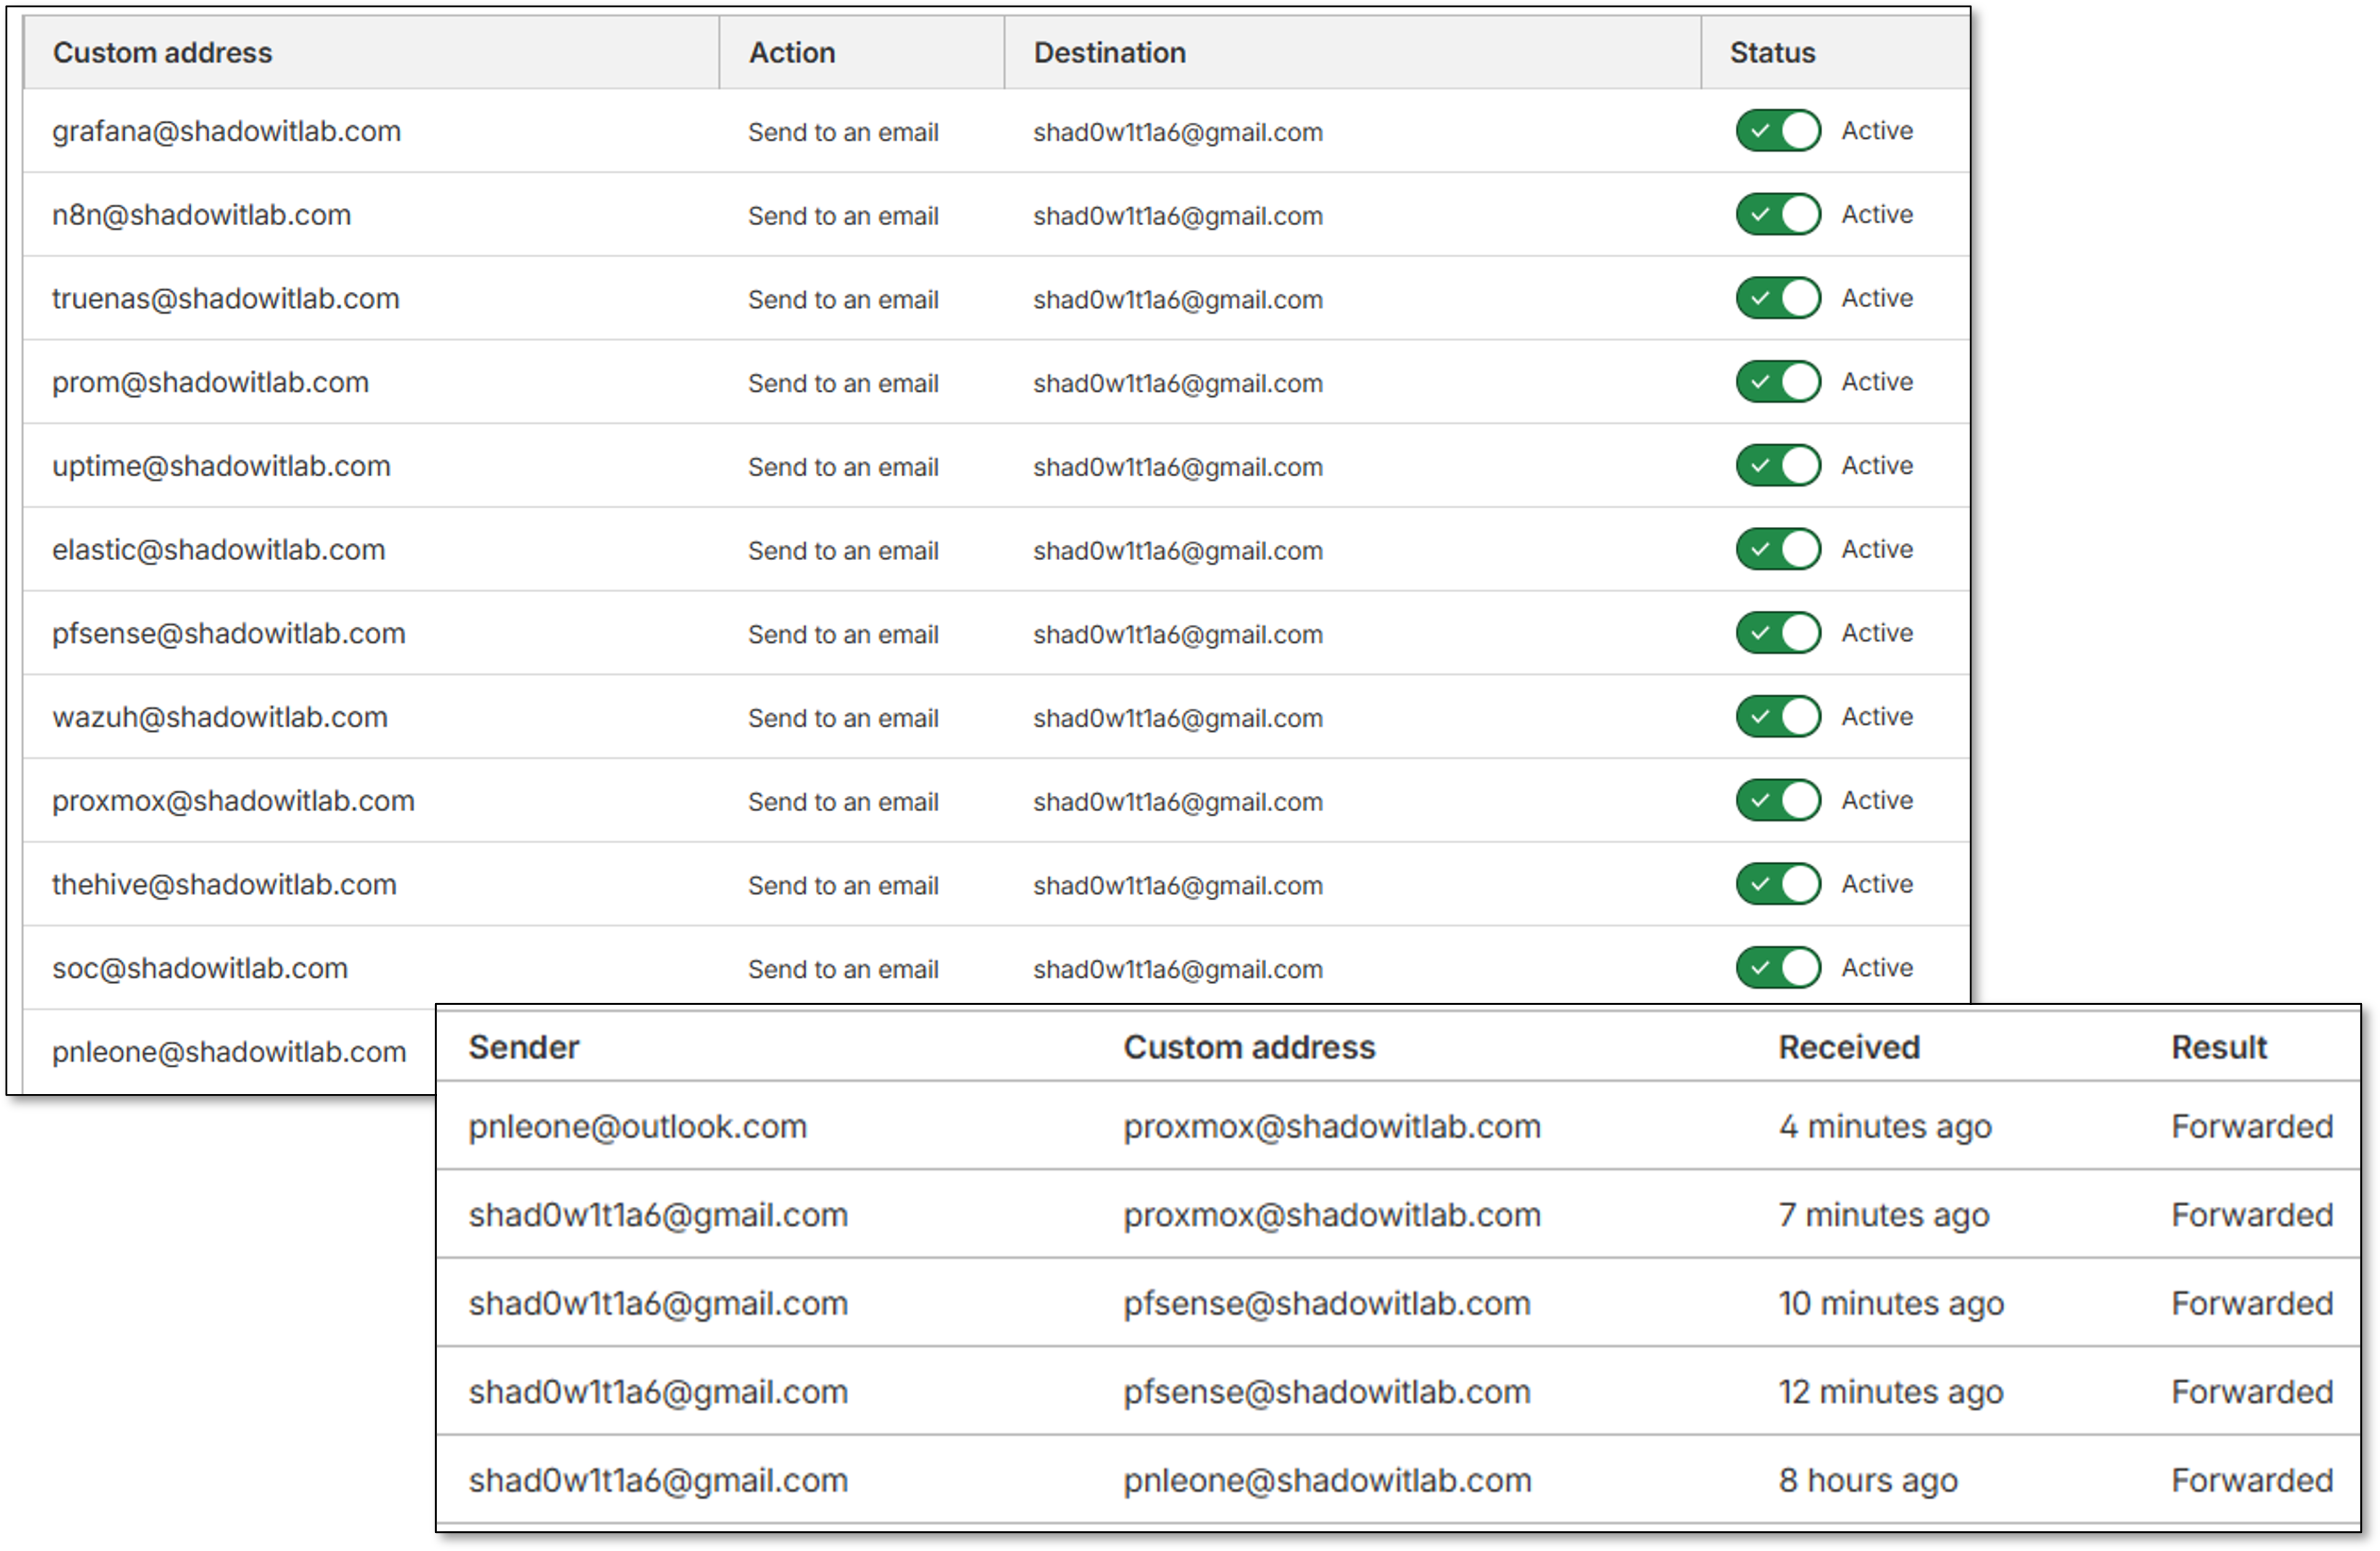
Cloudflare Email Routing
Cloudflare Email Routing provides alias-based forwarding for individual services, enabling clean separation of alert sources and simplified identity management. Each service is assigned a unique alias for traceability.
Security Impact:
- Prevents spoofing by enforcing domain-validated routing
- Enables per-service alert attribution
- Provides an additional layer of redundancy
Deployment Rationale:
Cloudflare's routing service mirrors enterprise email aliasing strategies, improving traceability and reducing operational complexity.
Architecture Principles Alignment:
Defense in Depth: Adds routing redundancy and identity separation
Secure by Design: Domain-validated forwarding; Cloudflare-managed security
Zero Trust: Each alias treated as an independent identity; no implicit trust
Security Controls Summary
Control Framework
| Control Domain | Implementation | Coverage |
|---|---|---|
| Log Aggregation | Splunk + Elastic centralized collection | All infrastructure |
| Endpoint Detection | Wazuh EDR on 25+ hosts | Windows, Linux, macOS, BSD |
| Network Monitoring | Suricata/Snort IDS on all interfaces | 100% traffic inspection |
| File Integrity Monitoring | Wazuh FIM on critical paths | System files, configs |
| Vulnerability Assessment | Wazuh + OpenVAS automated scanning | All hosts |
| Compliance Auditing | Wazuh SCA policies (CIS, PCI-DSS) | Continuous assessment |
| Alert Correlation | Splunk SPL queries, Elastic detection rules | Multi-source correlation |
| Incident Response | Automated containment, Discord alerting | Real-time response |
| Audit Logging | 90-day retention in SIEM | Full audit trail |
| Performance Monitoring | Prometheus + Grafana dashboards | All infrastructure |
Security Event Pipeline
- Collection: Agents/forwarders collect logs from sources
- Transport: Encrypted TLS/SSL to SIEM platforms
- Parsing: Field extraction and normalization
- Enrichment: GeoIP, threat intel, asset context
- Correlation: Multi-source event correlation
- Detection: Rule-based and ML anomaly detection
- Alerting: Discord webhooks + email notifications
- Response: Automated containment actions
- Investigation: Search and visualization tools
- Retention: 90-day storage, then archive
Data Classification
| Data Type | Sensitivity | Retention | Encryption |
|---|---|---|---|
| Security Alerts | High | 90 days | At rest + in transit |
| System Logs | Medium | 90 days | At rest + in transit |
| Application Logs | Low | 30 days | In transit only |
| Performance Metrics | Low | 90 days | None |
Access Control
- SIEM Platforms: Authentik SSO with MFA required
- API Access: API tokens with 90-day rotation
- Dashboard Access: Role-based permissions (admin, analyst, viewer)
- Alert Management: Admin-only response actions
Encryption Standards
- Log Transport: TLS 1.3 for all forwarder connections
- At Rest: AES-256 for stored logs and backups
- Certificates: Step-CA issued, auto-renewed
Detection Use Cases
Use Case 1: Brute Force SSH Attack Detection and Response
Objective: Detect and automatically block SSH brute force attempts
Workflow:
- Attacker attempts SSH login to docker-vm-01 from 192.168.1.99
- Failed attempts logged to /var/log/auth.log
- Splunk Universal Forwarder forwards logs to Splunk indexer
- Splunk correlation search detects >20 failed attempts in 5 minutes
- Alert triggered: "SSH Brute Force from 192.168.1.99"
- Discord webhook notification sent to #security channel
- Wazuh active response triggers firewall-drop.sh script
- iptables rule added: Block 192.168.1.99 for 10 minutes
- Security analyst reviews alert in Splunk dashboard
- Analyst extends block to permanent if deemed malicious
SPL Query:
index=auth sourcetype=syslog "Failed password"
| rex field=_raw "Failed password for (?<user>\w+) from (?<src_ip>\d+\.\d+\.\d+\.\d+)"
| stats count by src_ip, dest_host
| where count > 20
| eval threat_level="High", action="Block IP"
Use Case 2: Wazuh Malware Detection with VirusTotal Integration
Objective: Detect execution of malicious file on Windows endpoint with automated analysis and quarantine
Workflow:
- User on Win11Pro opens email attachment
- File (suspicious.exe) is written to Downloads folder
- Wazuh FIM detects new file creation
- Wazuh forwards file hash to VirusTotal via integration
- VirusTotal returns 45/70 detections (Trojan.Downloader)
- Wazuh custom rule 87105 triggers on positive detections
- Wazuh active response executes remove-threat.sh
- File quarantined to secure location
- Wazuh generates Critical alert (level 15)
- Alert forwarded to Splunk for correlation
- Discord notification: "CRITICAL: Malware detected on Win11Pro"
- TheHive case created via Shuffle workflow
- Cortex analyzers provide additional context
- Security analyst reviews case with pre-loaded enrichment
Wazuh Rule:
<rule id="100200" level="15">
  <if_sid>18106</if_sid>
  <field name="win.eventdata.image">\.exe$</field>
  <field name="win.eventdata.commandLine">\\Temp\\</field>
  <description>Suspicious executable launched from Temp directory</description>
  <mitre>
    <id>T1204.002</id>
  </mitre>
</rule>
Use Case 3: Lateral Movement via RDP
Objective: Identify attacker moving between hosts after initial compromise
Workflow:
- Attacker compromises Win11Pro via phishing
- Attacker attempts RDP to DC01 using stolen credentials
- Suricata IDS detects RDP connection: 192.168.1.200 → 192.168.1.152:3389
- Windows Security Event 4624 (Successful Logon) on DC01
- Wazuh agent on DC01 forwards event to manager
- Splunk correlation search identifies:
- User "jdoe" logged in from Win11Pro (unusual source)
- Time: 2:30 AM (outside normal business hours)
- Logon Type 10 (RemoteInteractive/RDP)
- Alert generated: "Suspicious Lateral Movement Detected"
- Discord notification with full context
- Analyst reviews:
- User's normal login pattern (9 AM - 5 PM from office PC)
- No scheduled maintenance windows
- Source host shows signs of compromise
- Analyst disables user account in AD
- Terminates RDP session on DC01
- Initiates forensic investigation
Splunk Correlation Query:
(index=wazuh-alerts rule.id="60204") OR (index=suricata-prod_lan dest_port=3389)
| eval time_hour=strftime(_time,"%H")
| where (time_hour < 6 OR time_hour > 22)
| stats values(src_ip) as source_ips, values(dest_ip) as dest_hosts by user
| where mvcount(dest_hosts) > 1
| eval threat="Lateral movement: user accessed multiple hosts outside business hours"
Use Case 4: Configuration Drift Detection
Objective: Detect unauthorized changes to critical system configurations
Workflow:
- Attacker gains access to web server (Apache LXC)
- Modifies /etc/ssh/sshd_config to enable PasswordAuthentication
- Wazuh FIM detects file change within seconds
- Wazuh generates alert with file diff:
- Old value: PasswordAuthentication no
- New value: PasswordAuthentication yes
- Alert includes MD5/SHA256 hash of modified file
- Alert forwarded to Splunk and displayed in dashboard
- Discord notification: "File Integrity Violation on Apache LXC"
- Analyst reviews change:
- Change made by root user
- No change ticket associated with modification
- Unauthorized change confirmed
- Wazuh active response:
- Restores original sshd_config from backup
- Restarts SSH service with secure config
- Analyst investigates how attacker gained root access
Wazuh FIM Alert:
Event: Modified
File: /etc/ssh/sshd_config
Old MD5: a1b2c3d4e5f6...
New MD5: f6e5d4c3b2a1...
User: root
Time: 2024-11-06 14:23:45
Severity: High (level 10)
Use Case 5: CIS Benchmark Compliance Violation
Objective: Identify hosts failing CIS benchmark requirements
Workflow:
- Wazuh SCA scan runs every 12 hours
- Scan detects violations on DC01:
- Password minimum length: 8 (Required: 14)
- Account lockout threshold: 5 (Required: 3)
- Audit log retention: 30 days (Required: 90 days)
- Wazuh generates compliance report
- Report forwarded to Splunk
- Compliance dashboard shows:
- Overall score: 89.2% (below 95% target)
- Critical failures: 3
- Affected hosts: DC01
- Weekly compliance report emailed to IT management
- Security team creates remediation tickets:
- GPO update for password policy
- GPO update for lockout threshold
- Increase audit log retention
- Changes applied via Group Policy
- Next scan confirms compliance: 96.5%
Wazuh Compliance Query:
Policy: CIS Windows Server 2022
Failed Checks: 3
Score: 89.2%
Risk Level: Medium
Security Homelab Section Links
- Executive Summary and Security Posture
- Infrastructure Platform, Virtualization Stack and Hardware
- Network Security, Privacy and Remote Access
- Identity, Access, Secrets and Trust Management
- Automation and IaC
- Applications and Services
- Observability and Response, Part 1
- Observability and Response, Part 2
- Cloud IaaS Integration – AWS, Azure and GCP